The use of the term "empowerment" in mental health settings has burgeoned in the past decade, perhaps fueled by the disenfranchisement, lack of choice and control, and powerlessness felt by mental health consumers (
1 ). Early definitions of empowerment (
2 ) attempted to capture its dimensions, which are often viewed as multidimensional, with psychological, social, and political components. Key elements of empowerment, according to Clark and Krupa (
3 ), include personal control, action, power sharing, dignity, and equity. But despite the nearly ubiquitous use of empowerment as a term in the mental health field, there remains little consensus about its meaning; its definition is further complicated by the fact that it has been used to describe person-level attributes, program-level practices, and system-level characteristics. The Empowerment Scale represents an attempt to operationalize and measure personal empowerment. The scale has been widely used, and a small number of validity studies have been conducted (
4,
5 ).
This study analyzed the psychometric properties of the Empowerment Scale as used with a large, representative sample of respondents and examined its relationship to hope, social acceptance, quality of life, and attitudes toward recovery.
Methods
Participants of the multisite study of eight consumer-operated programs had a
DSM-IV axis I or II diagnosis that would generally be considered to constitute serious mental illness, such as schizophrenia, schizoaffective disorder, or major depression. In addition, all study participants had to be age 18 or older, able to provide full and knowing consent, and actively involved with services from a mental health provider. Exclusion criteria included an inability to participate in the research interviews and more than minimal involvement in the consumer-operated programs under study within the six months before baseline. A fuller description of the methods and procedures for this study can be found elsewhere (
6 ).
A common assessment tool, comprising 27 scales or domains, was used across all sites and with all participants. The protocol measured demographic and clinical variables as well as subjective indicators, such as quality of life and hope. Pilot testing of the assessment protocol and standardized training for interviewers were undertaken to ensure accurate data collection.
Among the measures used was the Empowerment Scale, a 28-item instrument designed to measure subjective feelings of empowerment on a 4-point Likert scale ranging from "strongly agree" to "strongly disagree" (
4 ). Previously established subscales tap the domains of self-efficacy, perceived power, optimism about and control over the future, and community activism. The scale has been demonstrated to have good consistency and internal reliability, as well as good factorial validity and known-groups validity (
4 ). The Personal Empowerment Scale, a ten-item subscale of the Segal Empowerment Scale, measures how much choice individuals have in their lives. Respondents use a 4-point Likert scale that ranges from "no choice" to "a lot of choice" (
2 ). The authors report adequate internal consistency for this subscale (r=.78).
To measure perceived recovery, we used the Recovery Assessment Scale, a 41-item instrument that measures perceptions of recovery from mental illness and having a sense of purpose in and control over one's life (
7 ). Scoring is on a 5-point Likert scale ranging from strongly agree to strongly disagree. Coefficient alphas for these subscales ranged from .74 to .87. Convergent and divergent validity are suggested by the scale's positive correlations with hope and quality of life and negative correlation with symptoms.
Included in the battery was the widely used Lehman Quality of Life Scale, an instrument to assess both objective and subjective quality of life across multiple domains (including global life satisfaction) on a 7-point Likert scale ranging from "terrible" to "delighted" (
8 ). The scale has demonstrated adequate test-retest reliability and validity, satisfactory parallel-form reliability, internal consistency, and difference score reliability (
8 ).
The Herth Hope Index is a 12-item instrument we used to measure the multidimensional construct of hope on a 4-point Likert scale ranging from "agree" to "disagree" (
9 ). The reported Cronbach's alpha coefficient measuring internal consistency of the scale is .97. The Social Acceptance Scale, including eight items from the Well-Being Project, measures how often respondents feel they are being treated differently by others and how accepted by others they perceive themselves to be (
10 ). Responses are recorded on a 5-point scale ranging from "all of the time" to "never." Reliability of the scale from this study suggests a Cronbach's alpha of .86. The Colorado Symptom Index (CSI) is a ten-item scale to which respondents report the frequency of specific symptoms of anxiety (such as "having trouble thinking straight") and psychosis (such as "hearing voices") (
11 ). The authors reported good internal consistency, with coefficient alphas ranging from .77 for anxiety to .85 for psychotic symptoms.
The Hopkins Symptom Checklist (HCL) is a widely used self-report instrument of symptoms (
12 ). We used items that did not duplicate the CSI items and report here on the depression subscale. Items are measured on a 4-point scale ranging from "not at all" to "extremely." The HCL has undergone extensive study of its psychometric properties, with hundreds of articles documenting its excellent internal consistency, test-retest reliability, and validity (
12 ).
The assessment protocol was administered after we recruited persons from participating mental health centers and obtained their informed consent. All informed consent forms and procedures were approved by local institutional review boards. The baseline assessment protocol consisted of a face-to-face interview that took two to three hours to complete. Participants were then randomly assigned to the experimental or control condition and followed up. We report here on only the baseline data. All data were collected between 1999 and 2004.
We conducted a variety of statistical analyses and determined descriptive statistics for items of the scale. We conducted confirmatory factor analyses to examine fit indices, exploratory factor analyses with principal-components analysis and varimax rotation, tests of internal consistency with analysis of variance and linear regression, and correlational analyses to examine convergent and divergent validity. Model fit, or the extent to which the confirmatory factor analyses indicated that the data fit the model specified by an exploratory factor analysis, was determined with several indices, including Bentler's comparative fit index, the Bentler-Bonett nonnormed fit index, and the root mean square error of approximation (RMSEA) index of fit (
13 ).
Results
Results suggest that approximately one-half of the 1,827 individuals who participated in this study had a diagnosis of schizophrenia, schizoaffective disorder, or other psychotic disorders (N=912); 22% had a diagnosis of major depression or affective disorders (N=403); and 18% (N=320) had bipolar disorder. The rest of the participants had various other disorders (approximately 10%, N=192). Most individuals reported their race-ethnicity as white (57%, N=1,039) but there was sizable minority representation, with 17% (N=302) of individuals identifying as African American and the remainder as Hispanic, other, or multiracial (26%, N=477). Only a small percentage of the sample were married (13%, N=229), most were receiving disability payments (84%, N=1,527), and most were currently taking or had recently taken psychotropic medications (96%, N=1,753). The mean±SD age was 43±10.21, and slightly more than half of the participants (60%, N=1,098) were female. Overall, these characteristics suggest a sample with a significant degree of disability and disadvantage; the sample was assumed to be representative of public mental health recipients because the recruitment efforts took place largely in publicly funded clinics.
Means for the individual items of the Empowerment Scale at baseline ranged from 2.12 to 3.36 (measured on a 4-point scale), with higher scores indicating greater perceived empowerment. Items with the lowest scores were internally oriented and related to self-esteem, social isolation, and the expression of anger, whereas items with the most favorable scores were externally oriented and related to community activism. The mean for the total Empowerment Scale was 2.81±.32, similar to the original validation study.
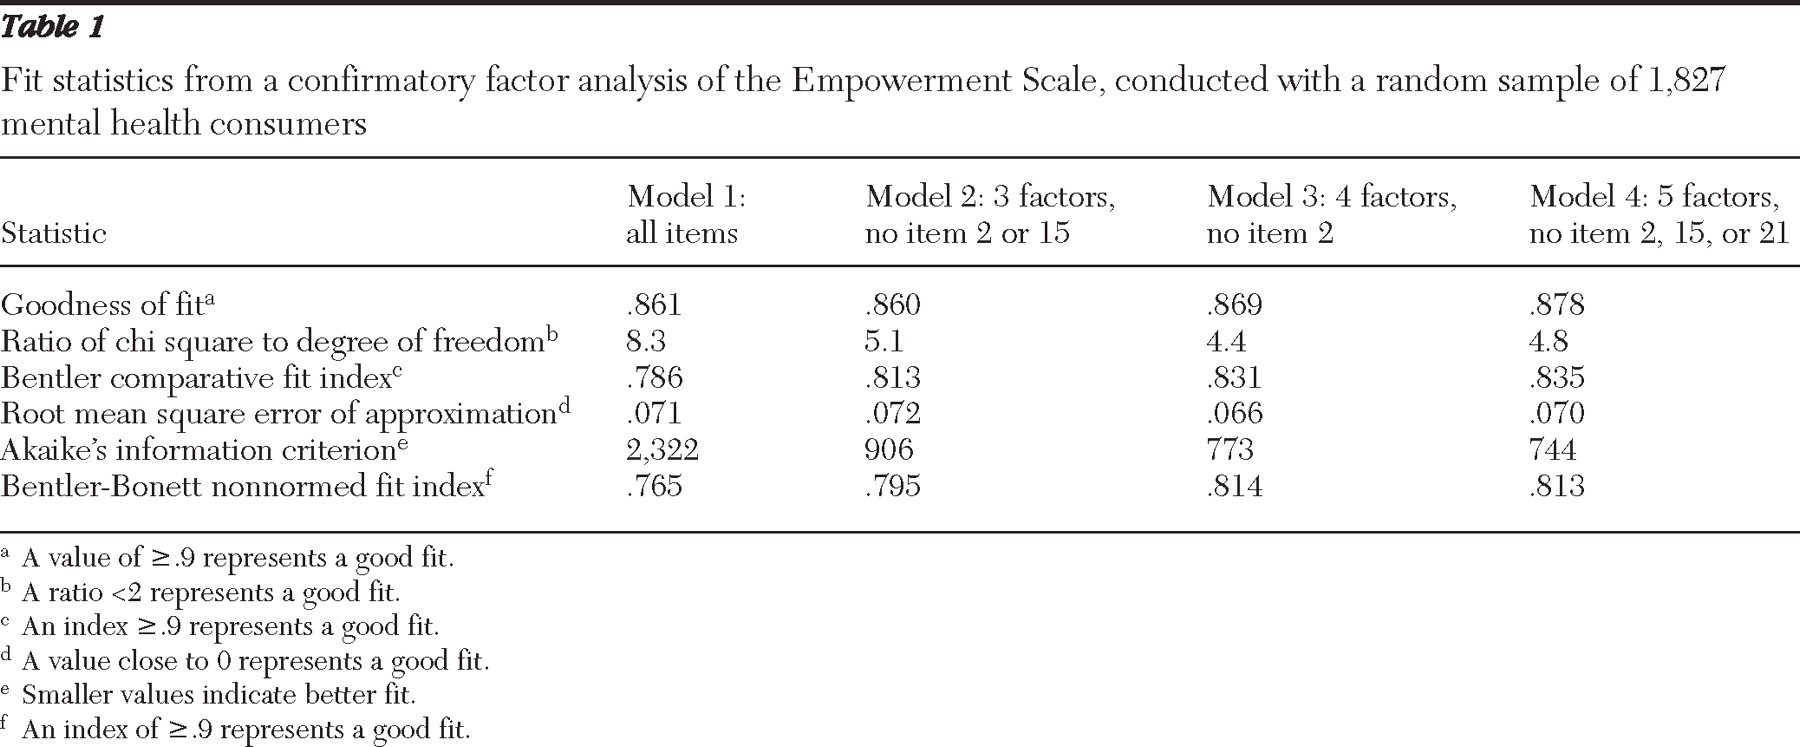
Results of confirmatory factor analysis to assess the fit to the original five-factor model with all 28 items suggested a fair fit, with a goodness-of-fit index of .861, RMSEA estimate of .071, and Bentler comparative fit index of .786. Because this model did not present an ideal fit, additional exploratory factor analyses (with a randomly constructed half of the data set) were conducted with principal-components analysis and varimax rotation. Two items ("People are only limited by what they think is possible" and "Getting angry about something is often the first step toward changing it," items 2 and 15, respectively) were excluded from these analyses because they did not load highly enough to warrant inclusion. Confirmatory factor analyses were conducted on the second half of the data set to assess the fit of a three-factor and a four-factor model (
Table 1 ). Although potentially more parsimonious, the fit statistics of this model were not substantially better than those of the original five-factor model.
Confirmatory analysis on the second half of the data set resulted in fit statistics that were slightly more favorable than those found with the original five factors on the entire data set and the statistics found with the three-factor model. There was no support for a two-factor solution.
Taking all of the findings together, the original five-factor solution was retained because neither the three- nor four-factor solutions produced dramatically better fit statistics or provided satisfactory conceptual clarity about the construct. We eliminated items 2 and 15 from further results and analyses because of their failure to load on any factors. In addition, repeated feedback from the field, including international collaborators, suggested that item 21 ("You can't fight City Hall") did not resonate with many respondents in other cultures and locations. This item was therefore excluded as well. Model 4 in
Table 1 contains the final model and associated fit statistics.
Cronbach's alpha on the total scale yielded an internal consistency of .82. Analysis of subscales generated from the factor analysis resulted in fair to excellent internal consistency (standardized alpha): factor 1, self-esteem, α =.82; factor 2, power and powerlessness, α =.59; factor 3, community activism and autonomy, α =.59; factor 4, optimism and control over the future, α =.45; and factor 5, righteous anger, α =.64.
Analyses suggested no differences in overall empowerment by gender, race, employment status, or diagnostic category. There were significant differences by marital status (F=10.64, df=2 and 1,807, p<.001), age (R 2 =.003, p=.029), and education (F=71.13, df=1 and 1,816, p<.001). Empowerment scores were higher among those married and older and with higher educational attainment. There was also a significant relationship between empowerment and earned income, with monthly income categorized into four levels (F=15.39, df=4 and 1,673, p<.001) and empowerment rising as reported income increased.
As expected, we found that the Empowerment Scale was moderately correlated with hope (r=.67), a sense of recovery (r=.67), the Segal measure of personal empowerment (r=.45), and quality of life (average of the subjective items, r=.44; item measuring satisfaction with life in general, r=.47). Correlations of empowerment with social acceptance, objective social inclusion, and subjective social inclusion were more modest (r=.25, r=.25, and r=.39, respectively). As hypothesized, we found inverse correlations of the Empowerment Scale with measures of symptomatology, including the Colorado measure of psychotic symptoms (r=–.39), and the Hopkins depression subscale (r=–.46).


