Patients
In the last 20 years, many patients have been discharged to the community from two large psychiatric nursing homes located in the rural county of Sogn and Fjordane in Norway. On November 15, 1989, a total of 107 long-term patients remained in the institutions. All of them had spent at least one year there, and 70 percent had been living in the institutions for ten years or more. These 107 patients constituted the entire population of long-term inpatients in the county as of that date, and they accounted for .1 percent of the total population of the county catchment area (
7).
At follow-up six years later, many patients had moved back to their community of origin after planned discharges. Thirty-two patients had died. Those who had died were significantly older in 1989 than those who survived (mean±SD=68.7±13.9 years, compared with 53.4±15.3 years; t=4.87, df=105, p<.001). The mean age at death for the patients who had died was 10.5 years below the life expectancy for the general population.
Of the 75 patients who were alive at the time of the follow-up, one patient did not want to participate in the study. The remaining 74 patients included 54 men and 20 women with a mean±SD age of 60.4±14 years. Sixty-nine percent met criteria for a
DSM-III-R diagnosis of schizophrenia. Eighty-four percent had never been married. Thirty patients, or 41 percent, were living in general nursing homes; 23 patients, or 30 percent, remained in the county-run psychiatric nursing homes; and 21 patients, or 29 percent, lived outside of institutions in a personal residence. All except three patients had regular contact with the health care system (
8).
Study procedure
The research protocol was approved by the regional ethical committee for medical research. Local health care providers asked the patients to take part in the study. All patients were visited by a member of the research team between January and June 1996. The team included two psychiatrists, one resident, one psychologist, and two psychiatric nurses.
Sociodemographic data were obtained from local health care providers who knew the patients well using a questionnaire that included questions on the patient's life situation and contact with others.
Each patients' level of symptoms was measured by a research team member using the Brief Psychiatric Rating Scale (BPRS), expanded version 3.0. (
9). Higher scores on the BPRS indicate more severe symptoms. Level of functioning was assessed using the Rehabilitation Evaluation of Hall and Baker (REHAB) (
10), on which higher scores indicate worse functioning, and the Global Assessment of Functioning (GAF) (
11), on which higher scores indicate better functioning. Twenty patients were interviewed by one member of the research team in the presence of the others, who also rated these patients on the REHAB, BPRS, and GAF. The intraclass coefficients were above .9 for all subscales and total scores (
12).
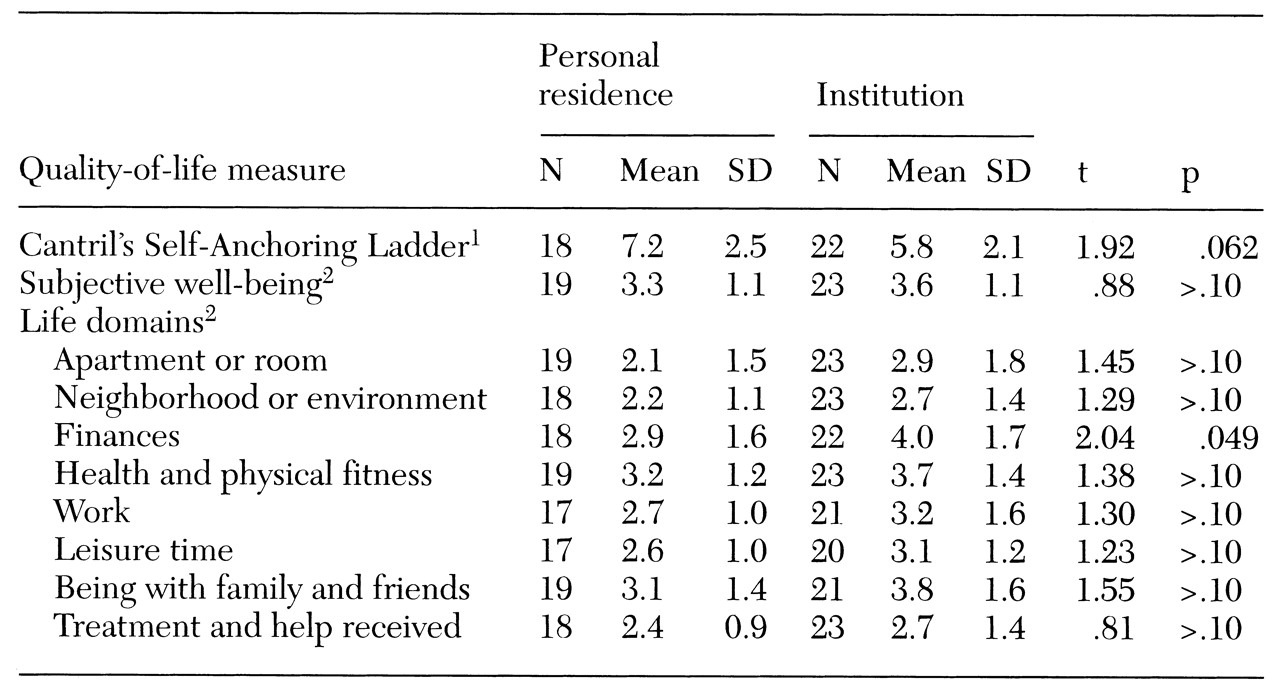
How often patients felt lonely was scored on a 5-point self-report scale on which 1 represented never; 2, seldom; 3, sometimes; 4, often; and 5, very often. Quality of life was assessed using a 14-item self-report questionnaire based on an instrument developed in Norway by Sørensen and Næss (
2). The first three questions asked respondents to rate on a scale from 1 to 7 how happy or unhappy or how satisfied or dissatisfied they felt and how encouraging or disappointing life was at the moment. The scores on these three questions were strongly intercorrelated (r values ranged from .56 to .69, p<.01). In the data analysis, these questions were combined into one variable called subjective well-being. This new variable was strongly correlated with the three original variables (r values ranged from .82 to .87, p<.001).
The fourth question asked respondents to rate their present level of happiness using Cantril's Self-Anchoring Ladder, a ten-point scale anchored by respondents' own identified values (
13). The remaining ten questions asked patients to rate their satisfaction with various life domains on a scale from 1 to 7.
Data were analyzed using SPSS for Windows, version 7.0. T tests, Pearson's r correlation analyses, chi square tests, and discriminant and linear regression analysis were used. The level of significance for all tests was .05 if not otherwise stated.


