Full access
Brief Report
Published Online: 1 October 1999

Compounds Containing Cytosolic Choline in the Basal Ganglia: A Potential Biological Marker of True Drug Response to Fluoxetine

Publication: American Journal of Psychiatry

Abstract

OBJECTIVE: Studies have identified two types of antidepressant response: true drug response and placebo pattern response. This study examined the relationship between true drug response and choline-creatine ratios in the basal ganglia of depressed patients treated with fluoxetine. METHOD: The authors evaluated drug-free outpatients with major depression before (N=41) and after (N=15) 8 weeks of fluoxetine treatment, 20 mg/day, by using proton magnetic resonance spectroscopy. RESULTS: There was a significant difference in the degree of change from baseline to week 8 in choline-creatine ratios between the true drug response group (N=8) and the placebo pattern response/nonresponse group (N=7); the true drug response patients had a 20% increase in choline-creatine ratios, and the placebo pattern response/nonresponse patients had a 12% decrease in choline-creatine ratios. CONCLUSIONS: These data suggest that true drug response to fluoxetine treatment in depression may be associated with an increase in choline-creatine ratios in the basal ganglia.
Studies using pattern analysis have distinguished between true drug response and the placebo pattern of response (1). While true drug response is characterized by a 2-week delay in onset followed by persistent improvement, placebo pattern response is characterized by early, transient, or nonpersistent improvement (1). Biological markers of true drug response, however, are lacking.
Two studies (2, 3) demonstrated the feasibility of applying localized proton magnetic resonance spectroscopy (MRS) to patients with depression and control subjects as a means of noninvasively detecting cytosolic-choline-containing compounds in the brain (4, 5). Specifically, Charles and co-workers (2) found an 18% elevation in choline-creatine ratios in the subcortical gray matter structures (including the basal ganglia and the thalamus) of older patients with major depression in comparison with older subjects without depression. Renshaw and colleagues (3) found significantly lower choline-creatine ratios in the basal ganglia of patients with depression than in those of nondepressed subjects. The subjects with depression in the Renshaw et al. study were younger than those in the Charles et al. study. Morphometric magnetic resonance imaging studies have noted that caudate and putamen volumes are smaller in elderly patients with depression than in matched control subjects (6). This leads to different proportions of gray and white matter within the volumes of interest and thereby potentially confounds localized proton MRS results because choline and crea­tine have a different signal intensity in gray matter than in white matter. This may explain the difference in the results between the two studies (7).
The purpose of this study was to evaluate the relationship between basal ganglia choline-creatine ratios, as measured by in vivo localized proton MRS, among patients with a true drug response compared to those without a true drug response following antidepressant treatment.

METHOD

After complete description of the study to the subjects, written informed consent was obtained before participation in this study. The subjects with depression were outpatient participants in a standardized treatment trial. Patients were requested to undergo localized proton MRS before and after an 8-week open trial with fluoxetine, 20 mg/day.
Forty-one drug-free patients with depression between 19 and 56 years of age who met the criteria for major depressive disorder on the Structured Clinical Interview for DSM-III-R—Patient Edition (8) and received an initial 17-item Hamilton Rating Scale for Depression (9) score of 16 or greater were included in the study. The exclusion criteria for this study were as described previously (3).
All patients underwent in vivo localized proton MRS by means of a Signa 1.5-T scanner (General Electric Medical Systems, Milwaukee) equipped with a level-4.8 operating system. Spectra were acquired by means of an 8-cm3 voxel centered on the head of the left caudate and the putamen. Methods for localized proton MRS are described in detail elsewhere (3). Fifteen of these 41 patients underwent the same MRS assessment at the end of 8 weeks of fluoxetine treatment, 20 mg/day.
Patients were assessed weekly by using the Clinical Global Impression (CGI) (10) severity and improvement scales. On the basis of identification of patterns of improvement by Stewart et al. (1), a score of 1 (“very much improved”) or 2 (“much improved”) on the CGI improvement scale in any week was considered improved.
One-factor analysis of variance (ANOVA) was used to compare choline-creatine and N-acetylaspartate-creatine ratios at baseline and after 8 weeks of fluoxetine treatment among patients with true drug response and patients with placebo pattern response/nonresponse.

RESULTS

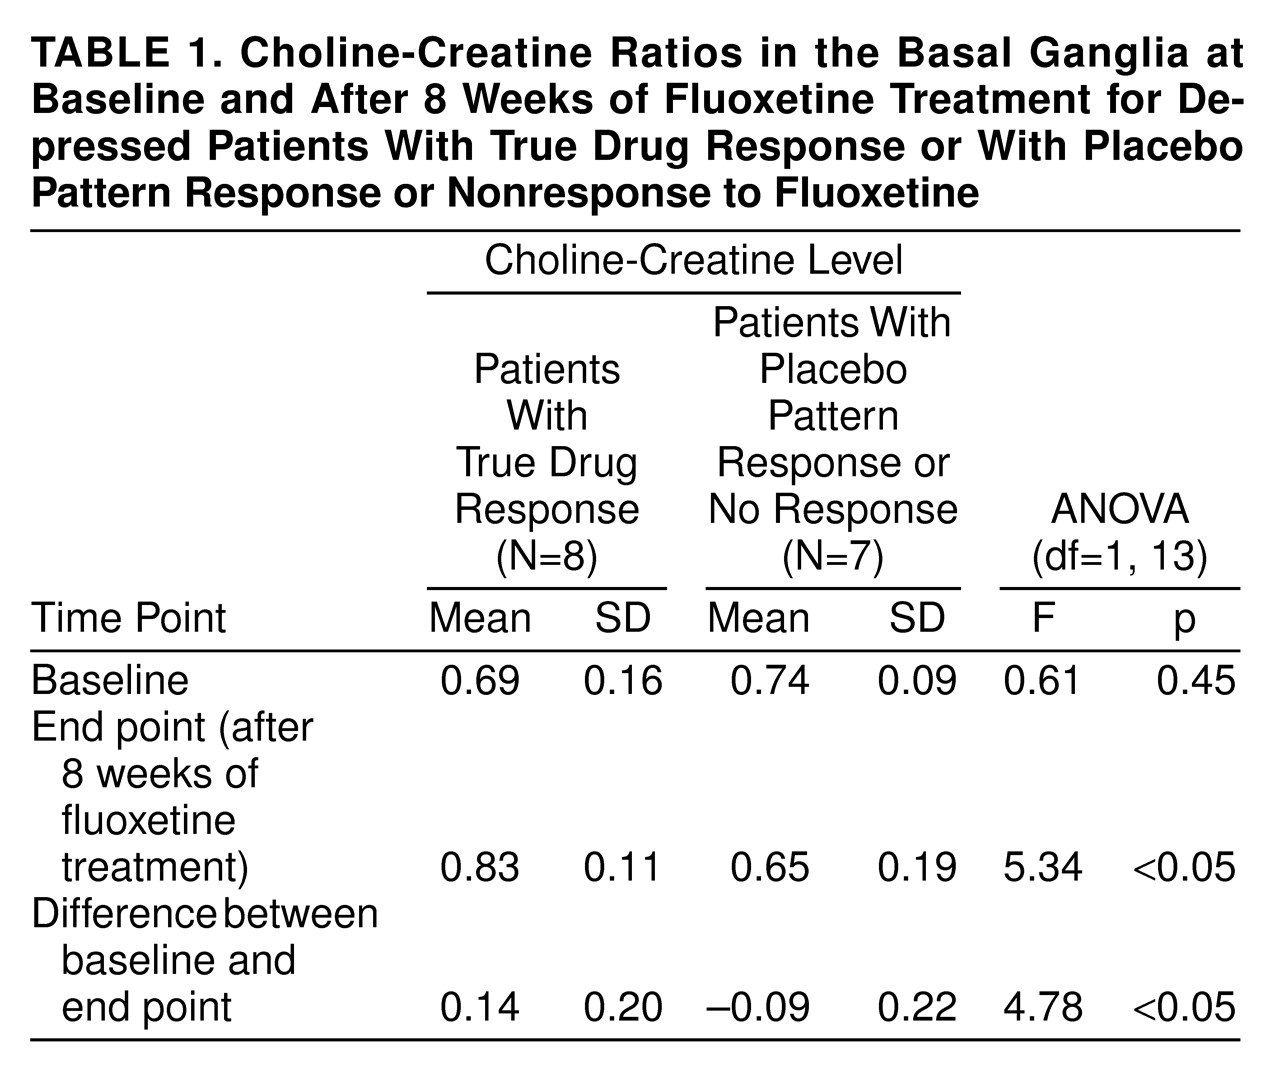
The mean age of the 41 patients was 38.9 years (SD=9.4) (44% women, N=18). All but one of the 41 depressed patients was strongly right-handed, as assessed by the Edinburgh inventory (11). The mean 17-item Hamilton depression scale baseline score was 20.8 (SD=3.8). Of the 41 patients, 24 had never before been treated for depression, and treatment data were unavailable for four patients. In the 13 patients who received previous treatment, the mean drug-free period was 2.3 years (SD=2.2). There were no significant differences between the true drug response group and the placebo pattern response/nonresponse group across demographic factors, including age and gender, and across pretreatment 17-item Hamilton depression scale scores. ANOVAs revealed no statistically significant differences in the baseline choline-creatine and N-acetylaspartate-creatine ratios in the basal ganglia between the true drug response group and the placebo pattern response/nonresponse group. Of the 15 patients who underwent a repeat MRS at the end of 8 weeks, eight patients had a true drug response, four patients had a placebo pattern response, and three patients had no response. There were no significant differences in age, CGI severity scores, and baseline choline-creatine and N-acetylaspartate-creatine ratios between the two groups (one with baseline MRS only [N=41] and the other with both baseline and repeat MRS [N=15]). However, there was a statistically significant difference in the degree of change from baseline in choline-creatine ratios between the true drug response group (N=8) and the placebo pattern response/nonresponse group (N=7), with the true drug response patients having a 0.14 (20%) increase in choline-crea­tine ratios from baseline and the placebo pattern response/nonresponse patients having a 0.09 (12%) decrease in the choline-creatine ratios at week 8 (Table 1). There was no significant difference change in N-acetylaspartate-creatine ratios between the two groups after 8 weeks of treatment with fluoxetine (F=1.13, df=1, 13, p=0.3).

DISCUSSION

To our knowledge, this is the first study evaluating the relationship between basal ganglia choline-creatine ratios, as measured by in vivo localized proton MRS, and patterns of response to antidepressant medication.
The findings of our study are limited by the small number of patients involved and by the fact that nonresponders and placebo pattern responders were lumped together. We are also aware of the limitations involved in using metabolite ratios. In particular, a change in choline-creatine ratios may reflect either a change in ratios of choline-containing compounds or a change in ratios of creatine and phosphocreatine or both. This error could be compounded if different amounts of gray and white matter were contributing to the measured volumes of interest because choline and creatine ratios are different in gray and white matter (12, 13).
Within the framework of these limitations, these pilot data suggest that true drug response to fluoxetine treatment in depression may be associated with an increase in choline-creatine ratios in the basal ganglia.
TABLE 1

Footnote

Presented in part at the 151st annual meeting of the American Psychiatric Association, Toronto, May 30–June 4, 1998. Received Feb. 20, 1998; revisions received July 30 and Dec. 22, 1998; accepted Feb. 23, 1999. From the Depression Clinical and Research Program, Massachusetts General Hospital, Harvard Medical School; and the McLean Brain Imaging Center, McLean Hospital, Harvard Medical School, Belmont, Mass. Address reprint requests to Dr. Sonawalla, Department of Psychiatry, Massachusetts General Hospital, WACC 812, 15 Parkman St., Boston, MA 02114. Supported by NIMH grant MH-48483 and the Stanley Foundation.

References

1.
Stewart JW, Quitkin FM, McGrath PJ, Amsterdam J, Fava M, Fawcett J, Reimherr F, Rosenbaum J, Beasley C, Roback P: Use of pattern analysis to predict differential relapse of remitted patients with major depression during 1 year of treatment with fluoxetine or placebo. Arch Gen Psychiatry 1998; 55:334–343
2.
Charles HC, Lazeyras F, Krishnan KR, Boyko OB, Payne M, Moore D: Brain choline in depression: in vivo detection of potential pharmacodynamic effects of antidepressant therapy using hydrogen localized spectroscopy. Prog Neuropsycho­pharmacol Biol Psychiatry 1994; 18:1121–1127
3.
Renshaw PF, Lafer B, Babb SM, Fava M, Stoll AL, Christensen JD, Moore CM, Yurgelun-Todd DA, Bonello CM, Pillay SS, Rothschild AJ, Nierenberg AA, Rosenbaum JF, Cohen BM: Basal ganglia choline levels in depression and response to fluoxetine treatment: an in vivo proton magnetic resonance spectroscopy study. Biol Psychiatry 1997; 41:837–843
4.
Frahm J, Bruhn H, Gyngell ML, Merboldt KD, Hänicke W, Sauter R: Localized high-resolution proton NMR spectroscopy using stimulated echoes: initial applications to human brain in vivo. Magn Reson Med 1989; 9:79–93
5.
Petroff OA: Biological 1H NMR spectroscopy. Comp Biochem Physiol 1988; 90:249–260
6.
Krishnan KRR, McDonald WM, Doraiswamy PM, Tupler LA, Husain M, Boyko OB, Figiel GS, Ellinwood EH Jr: Neuroanatomical substrates of depression in the elderly. Eur Arch Psychiatry Clin Neurosci 1993; 243:41–46
7.
Moore CM, Renshaw PF: Magnetic resonance spectroscopy studies of affective disorders, in Brain Imaging in Clinical Psychiatry. Edited by Krishnan KRR, Doraiswamy PM. New York, Marcel Decker, 1997, pp 185–213
8.
Spitzer RL, Williams JBW, Gibbon M, First MD: Structured Clinical Interview for DSM-III-R—Patient Version (SCID-P). New York, New York State Psychiatric Institute, Biometrics Research, 1989
9.
Hamilton M: A rating scale for depression. J Neurol Neurosurg Psychiatry 1960; 23:56–62
10.
Guy W (ed): ECDEU Assessment Manual for Psychopharmacology: Publication ADM 76-338. Rockville, Md, US Department of Health, Education, and Welfare, 1976, pp 217–222
11.
Oldfield RC: The assessment and analysis of handedness: the Edinburgh inventory. Neuropsychologia 1971; 9:97–113
12.
Kreis R, Ernst T, Ross BD: Absolute quantitation of water and metabolites in the human brain, II: metabolite concentrations. J Magn Reson B 1993; 102:9–19
13.
Tedeschi G, Bertolino A, Righini A, Campbell G, Raman R, Duyn JH, Moonen CT, Alger JR, Di Chiro G: Brain regional distribution pattern of metabolite signal intensities in young adults by proton magnetic resonance spectroscopic imaging. Neurology 1995; 45:1384–1389

Information & Authors

Information

Published In

Go to American Journal of Psychiatry
American Journal of Psychiatry
Pages: 1638 - 1640
PubMed: 10518178

History

Published online: 1 October 1999
Published in print: October 1999

Authors

Details

Shamsah B. Sonawalla, M.D.
Perry F. Renshaw, M.D., Ph.D.
Constance M. Moore, M.Sc., Ph.D.
Jonathan E. Alpert, M.D., Ph.D.
Andrew A. Nierenberg, M.D.
Jerrold F. Rosenbaum, M.D.

Metrics & Citations

Metrics

Citations

Export Citations

If you have the appropriate software installed, you can download article citation data to the citation manager of your choice. Simply select your manager software from the list below and click Download.

For more information or tips please see 'Downloading to a citation manager' in the Help menu.

Format
Citation style
Style
Copy to clipboard

View Options

View options

PDF/EPUB

View PDF/EPUB

Get Access

Login options

Already a subscriber? Access your subscription through your login credentials or your institution for full access to this article.

Personal login Institutional Login Open Athens login
Purchase Options

Purchase this article to access the full text.

PPV Articles - American Journal of Psychiatry

PPV Articles - American Journal of Psychiatry

Not a subscriber?

Subscribe Now / Learn More

PsychiatryOnline subscription options offer access to the DSM-5-TR® library, books, journals, CME, and patient resources. This all-in-one virtual library provides psychiatrists and mental health professionals with key resources for diagnosis, treatment, research, and professional development.

Need more help? PsychiatryOnline Customer Service may be reached by emailing [email protected] or by calling 800-368-5777 (in the U.S.) or 703-907-7322 (outside the U.S.).

Media

Figures

Other

Tables

Share

Share

Share article link

Share