Compounds Containing Cytosolic Choline in the Basal Ganglia: A Potential Biological Marker of True Drug Response to Fluoxetine
Abstract
METHOD
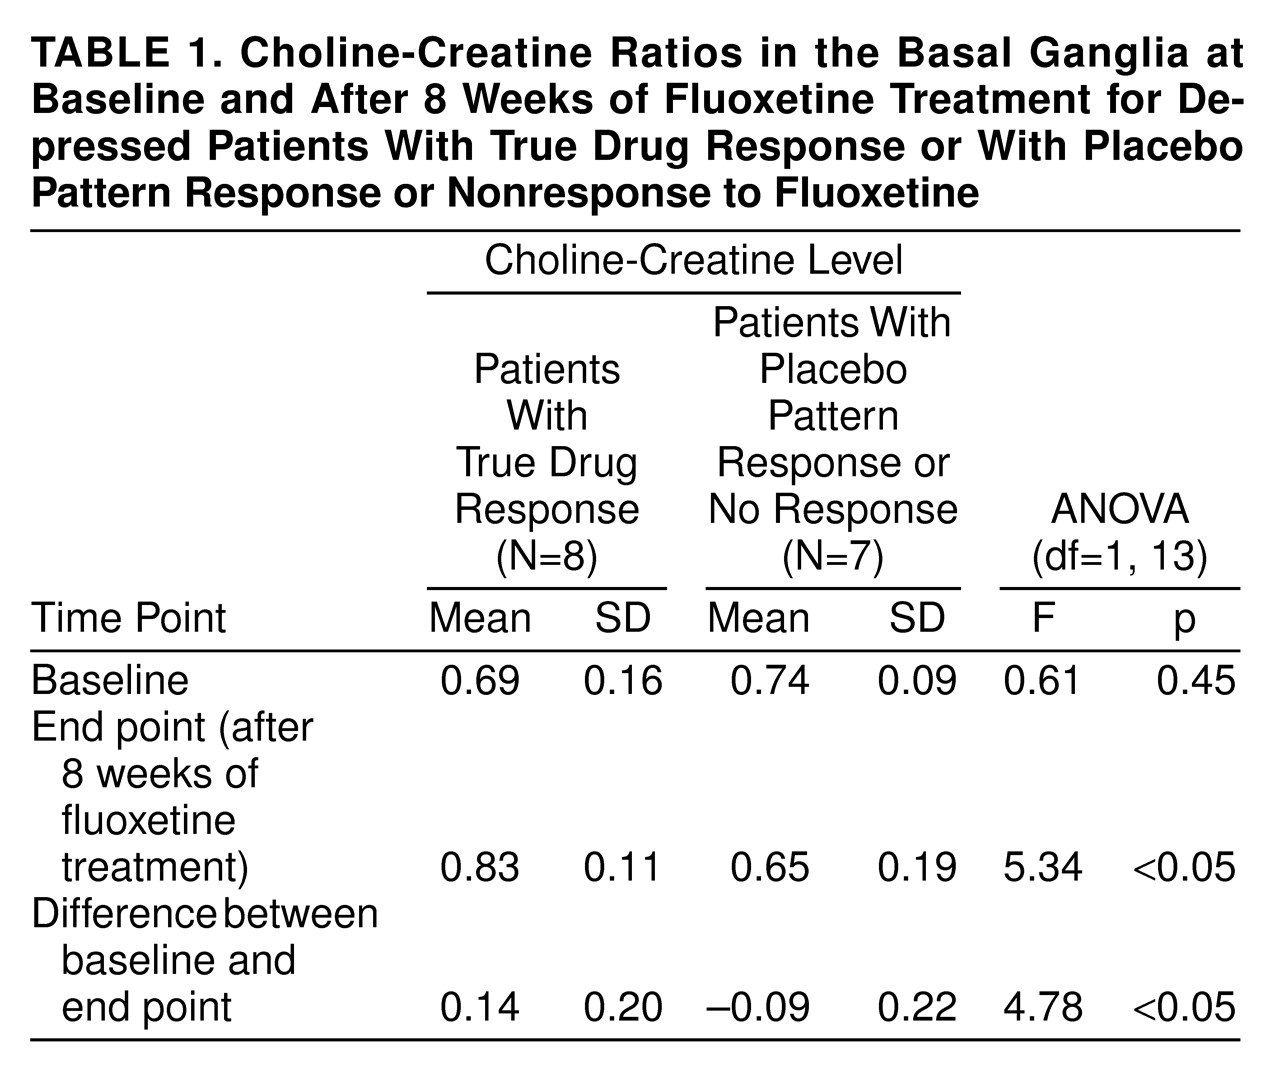
RESULTS
DISCUSSION
Footnote
References
Information & Authors
Information
Published In
History
Authors
Metrics & Citations
Metrics
Citations
Export Citations
If you have the appropriate software installed, you can download article citation data to the citation manager of your choice. Simply select your manager software from the list below and click Download.
For more information or tips please see 'Downloading to a citation manager' in the Help menu.
View Options
View options
PDF/EPUB
View PDF/EPUBGet Access
Login options
Already a subscriber? Access your subscription through your login credentials or your institution for full access to this article.
Personal login Institutional Login Open Athens loginNot a subscriber?
PsychiatryOnline subscription options offer access to the DSM-5-TR® library, books, journals, CME, and patient resources. This all-in-one virtual library provides psychiatrists and mental health professionals with key resources for diagnosis, treatment, research, and professional development.
Need more help? PsychiatryOnline Customer Service may be reached by emailing [email protected] or by calling 800-368-5777 (in the U.S.) or 703-907-7322 (outside the U.S.).