There is great interest in studying the cerebrovascular substrates of geriatric depression
(1–
3). Magnetic resonance (MR) imaging of blood flow in the smaller distal branches, referred to as “microcirculatory cerebral blood flow” (microcirculatory CBF), is a rapidly changing area
(4–
6). Methods involving MR arterial spin tagging use the water in blood as an endogenous freely diffusible tracer and offer the potential to measure regional microcirculatory CBF noninvasively
(4–
6). In this study we used modified echo-planar MR imaging (MRI) and signal targeting with alternating radio frequency
(4) to evaluate microcirculatory CBF in depressed subjects with coronary artery disease.
METHOD
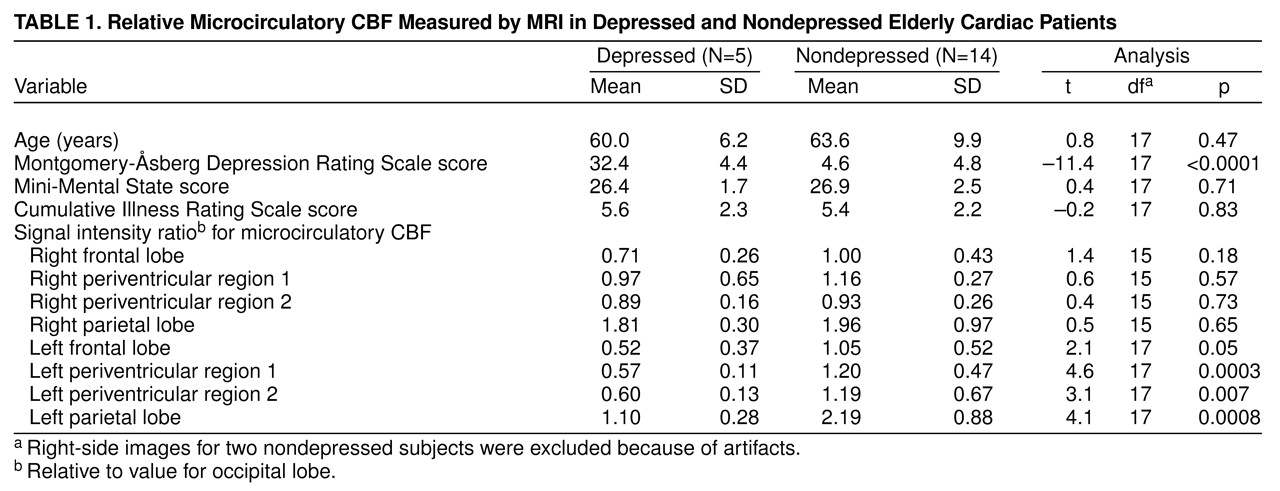
After complete description of this study to the subjects, written informed consent was obtained. Nineteen elderly subjects with coronary artery disease underwent interviews for depression and were assessed with the Mini-Mental State
(7) and the Cumulative Illness Rating Scale
(8), an assessment of medical burden (
Table 1). Five subjects had major depression according to the DSM-IV criteria and scored higher than 20 on the Montgomery-Åsberg Depression Rating Scale
(9); the other 14 were classified as nondepressed. Of the depressed subjects, four had recurrent illness, three had experienced onsets after age 50 years, and four had moderate-to-severe depression. Coronary artery disease was documented by using all available information. The severity of coronary artery disease was calculated according to the Duke Severity of Medical Illness Scale
(10); the mean score was 3.53 (SD=1.5) (possible range=0–12; a higher score indicates greater severity). Twelve subjects had hypertension, nine had diabetes, seven had congestive heart failure, 16 had one or more vessels with more than 75% occlusion, and the number of concurrent cardiovascular medications ranged from one to six.
The MR images were obtained with a 1.5-T MRI unit (GE Signa), and two axial arterial spin tagging images (2 cm apart, through the upper and lower halves of the lateral ventricle) were selected by using a spin echo localizer series. The arterial spin tagging method we used makes images of two slices at a time, creating two images per slice. One image has an intensity proportional to the tissue signal and the signal from the “tagged” blood that has flowed into the slice during the blood inflow interval, while the second image has an intensity proportional to the tissue signal and the “untagged” blood. Tagging is accomplished by using an adiabatic inversion pulse on the head region below the slice. Subtracting the two images for a given slice produces an image that is proportional to the blood flow. Additional data, such as the T1 relaxation time of the tissue and blood, must be acquired to actually calculate regional CBF. However, the ratio of the image intensity in one region to that in another reflects the relative blood flow. The pulse sequence characteristics were the following: 0.5-cm slice thickness, 40-cm field of view, 128×128 sampling matrix, TR=1400 msec, TE=27 msec, and imaging bandwidth=180 KHz. The inversion, tagging, pulse was a hyperbolic secant pulse that affected blood inferior to the slice, with an inflow delay between tagging and imaging of 1200 msec. There was a 1-cm gap between the inversion tag region and the imaged slices. Fifty repeated images were averaged for both the tagged and the untagged conditions, for a total imaging time of 2.5 minutes. Scans of all subjects had evidence of periventricular or subcortical hyperintensities.
The raw data for the images was transferred to a Sun SPARCstation 10 computer and processed by using computer programs based on interactive data language. The tagged and untagged images were separately averaged, and then the resulting two images were subtracted, yielding an image modeled
(11) under certain assumptions, depending on flow and other characteristics, as 2 M
0TI(f/λ)e
–TI/T1 where f=perfusive flow, λ=blood-tissue partition coefficient, TI=inversion time, T1=spin lattice relaxation time, and M
0=spin density. Thus, as long as similar tissues are compared, the comparison depends mainly on the relative values of f. Regions of interest were visually identified on a superimposed spin echo image and placed in five regions (frontal, parietal, two in periventricular/subcortical nuclei, and occipital) on the left and right sides to obtain signal intensity values corresponding to microcirculatory CBF. All measurements were obtained on an off-line console by an investigator who was blind to the diagnosis of depression, and the ratios reported are based on pixels within the defined regions of interest. Because of artifacts, we discarded measurements on the right side for two nondepressed subjects.
One-way analyses of variance (two-tailed, SAS Institute) were used to compare the groups. The SAS procedure for computing p values for unequal variances was used for comparisons in which the variances were unequal. Signal intensity ratios (relative to the occipital signal intensity on the same side) were used for group comparisons.
RESULTS
Microcirculatory CBF was statistically significantly lower for the depressed group than for the nondepressed group in the frontal, periventricular 1, periventricular 2, and parietal regions in the superior image for the left hemisphere (
Table 1). The values for the right side tended to be lower for the depressed group, but the differences did not reach statistical significance (
Table 1). Microcirculatory CBF for the depressed and nondepressed groups did not differ on the inferior image, although the values for the left periventricular regions of interest tended to be lower in the depressed subjects. When the ratios in the superior and inferior images were averaged, the depressed subjects had lower values for both left periventricular regions of interest (t=4.6, df=17, p<0.0003; t=4.3, df=17, p<0.0005) and the parietal region (t=2.6, df=17, p<0.02).


