Down’s syndrome represents a unique human genetic model with which to study the preclinical stages of Alzheimer’s disease. Individuals with Down’s syndrome show cognitive deterioration
(1,
2) and an increasing prevalence of dementia
(3) after the fifth decade of life. Earlier studies
(4) showed that the dementia syndrome in Down’s syndrome is phenotypically similar to Alzheimer’s disease and that excess expression of the β-amyloid (Aβ) protein is phenotypically equivalent to a gene mutation. It has further been shown that the dementia syndrome can occur without the mental retardation
(4). Although soluble Aβ
42 is deposited as early as fetal life
(5), it is only after age 40 years that adults with Down’s syndrome demonstrate neuropathologic
(6,
7) defects postmortem that meet criteria for Alzheimer’s disease, and it is even later when significant neurofibrillary tangles form in the neocortex
(6,
8). An overproduction of Aβ peptide due to an extra copy of the amyloid precursor protein on chromosome 21 is thought to contribute to Alzheimer’s disease in Down’s syndrome
(5,
9).
One such marker that has been investigated in Alzheimer’s disease is
myo-inositol, a polyol whose abnormal concentration has been implicated in the abnormal physiology of such disorders as diabetic neuropathy. In addition to serving as a precursor of phosphatidylinositol, the major inositol-containing phospholipid, and of phosphatidylinositol 4,5-bisphosphate, a key molecule in cellular signal transduction
(11,
12),
myo-inositol also plays an important role in osmoregulation
(13,
14). Studies with
1H magnetic resonance spectroscopy (MRS)
(15–
18) have shown high brain
myo-inositol levels in Alzheimer’s disease; CSF
(19) and postmortem
(20) studies both have shown levels 15% higher than normal, but the differences were not significant. It is not known whether high levels of
myo-inositol are present before the onset of dementia in people at risk for Alzheimer’s disease. In addition, studies of adults with Down’s syndrome, although showing a 50% higher CSF level of
myo-inositol than in comparison subjects, also showed a nonsignificant 9% higher
myo-inositol concentration in older than in younger Down’s syndrome subjects
(21). However, CSF studies of Down’s syndrome may potentially be complicated by the effect of the short stature or CSF production rates, and CSF studies do not allow regional quantitation of metabolite concentrations in the brain.
In the current study we sought to investigate regional in vivo brain concentrations of myo-inositol, choline-containing compounds, and other brain compounds in nondemented adults with Down’s syndrome, who have a 100% risk of developing Alzheimer’s disease neuropathology. To overcome the limitations of past studies, we compared Down’s syndrome adults over a wider age range than previously has been studied and used 1H MRS and external standards to compute absolute brain metabolite concentrations. We hypothesized that if a high myo-inositol level is related to the development of the preclinical stages of Alzheimer’s disease in Down’s syndrome, then older Down’s syndrome subjects would show higher myo-inositol levels than younger Down’s syndrome subjects.
METHOD
Subjects
We studied 19 adults with trisomy 21 Down’s syndrome who were recruited from family or group homes. No subject was demented, as assessed by a multidisciplinary dementia study group using standardized criteria
(26) and information from narrative reports of caretakers, clinical examination, and bedside mental status tests
(26). These subjects were divided into those younger than age 40 and those 40 or older. The eight young adults included six men and two women with a mean age of 35 years (SD=4, range=28–39). The 11 older adults included four men and seven women with a mean age of 47 years (SD=6, range=42–62); six of these subjects were older than 45 years. All of the subjects with Down’s syndrome underwent careful screening that included a review of medical history, physical and neurological examinations, routine blood and urine tests, chest X-ray, ECG, EEG, brain magnetic resonance imaging, and audiologic testing.
Eight of the healthy comparison subjects were under age 40: five men and three women with a mean age of 32 years (SD=7, range=22–39). Nine of the comparison subjects were 40 or older: four men and five women with a mean age of 51 (SD=9, range=40–64 years). The comparison subjects were screened in the same manner as the Down’s syndrome subjects. There was no difference in the distribution of ages (t=0.03, df=34, n.s.) or genders (χ2=0.1, df=1, n.s.) between the two groups.
The subjects had no history of neurologic or systemic medical disorder. None was taking medication for at least 2 weeks before the study, except for some of the Down’s syndrome subjects, who were taking thyroid replacement. After complete description of the study to each subject or to the holder of a durable power of attorney or legal guardian, written informed consent was obtained. The research was conducted under approved National Institutes of Health protocol 95-AG-0148.
MRS Data Acquisition
All in vivo magnetic resonance (MR) experiments were performed by using a 1.5-T GE Signa scanner and a standard quadrature head coil. The external standard method, one of the well-known MRS quantitation methods, was used. It is easy to perform and causes little or no discomfort to the subject given the small size of the phantom of the external standard and the relatively large size of the head coil. First, T
1-weighted sagittal and axial scout brain images (256 × 128 matrix size) were collected by using the spoiled gradient recalled acquisition in the steady state (spoiled-GRASS) pulse sequence with a 90° flip angle, TE=7 msec, TR=100 msec, 30 × 30 cm
2 field of view, and 5-mm slice thickness. The stimulated echo acquisition mode (STEAM) pulse sequence was used to acquire single-voxel in vivo
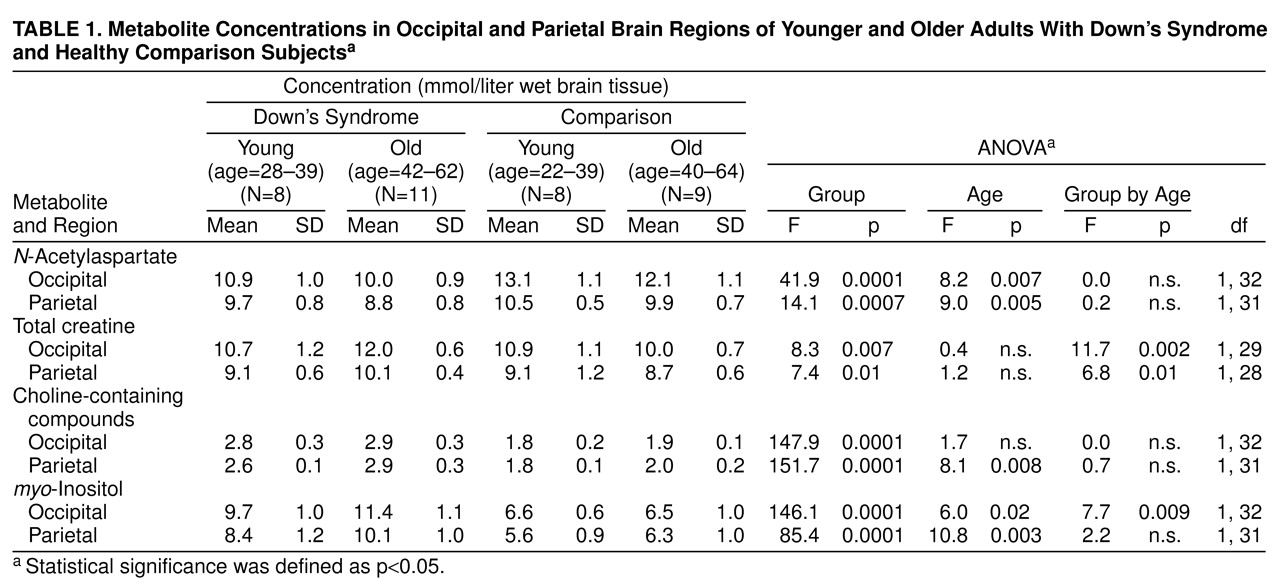
1H MRS data with TE=30 msec, TM=13.7 msec, TR=3000 msec, and 128-scan averages. As shown in
figure 1, the
1H spectral data were acquired from three square voxels (2.0 × 2.0 × 2.0 cm
3, or 8.0 cm
3) placed in the occipital area, parietal area, and external standard solution, respectively. These regions were selected because Alzheimer’s disease that appears in Down’s syndrome typically occurs first and is more severe in the association parietal cortex than in the primary occipital cortex
(27). After data acquisition, from the sagittal and axial images of each subject the average Talairach coordinates
(28) of the centers of the two brain voxels were determined: x=0.7 mm (SD=1.9), y=–74.4 mm (SD=11.3), z=20.3 mm (SD=3.9) in the occipital area, and x=–35.8 mm (SD=3.5) or 34.8 mm (SD=5.0), y=–69.5 mm (SD=7.0), z=20.3 mm (SD=3.9) in the parietal area. The external standard was a 250-ml plastic bottle filled with physiological saline solution containing 10.0-mM
N-acetylaspartate, 8.0-mM creatine, 2.0-mM choline chloride, and 5.0-mM
myo-inositol. The bottle was placed next to the subject’s head during MR scanning and was within the image field of view.
After MRS data acquisition, volumetric imaging was performed by using the spoiled-GRASS sequence to cover the slice thickness (2.0 cm) of the spectroscopic voxels. The imaging parameters included a 256 × 256 matrix size, 30 × 30 cm2 field of view, 3-mm slice thickness, 90° flip angle, TE=7 msec, TR=100 msec, and two-scan averages. A total of seven contiguous image slices were collected for each subject.
To measure T1 and T2 values of the metabolites in the brains of the subjects with Down’s syndrome, the brains of the comparison subjects, and standard solution, MRS data were collected with different TE values at a constant TR and different TR values at a constant TE for three Down’s syndrome subjects (28, 39, and 46 years old) and three comparison subjects (22, 34, and 53 years old) during separate scanning sessions and also from 1 liter of standard solution alone (seven times).
MRS Data Analysis
The MRS raw data were transferred to a Sun SPARC workstation (Sun Microsystems, Mountain View, Calif.) and processed by using SA/GE software. A 3-Hz exponential line broadening was applied to the time-domain raw data, followed by zero filling and Fourier transformation. After phase and baseline correction in the frequency domain, Marquardt functions were used to fit the resonance peaks of N-acetylaspartate, total creatine, choline-containing compounds, and myo-inositol, and their respective peak areas were measured.
For quantitation of metabolite concentrations, the following equation of MR signal intensity, S (represented by resonance peak area), for a STEAM sequence
(29) was used (
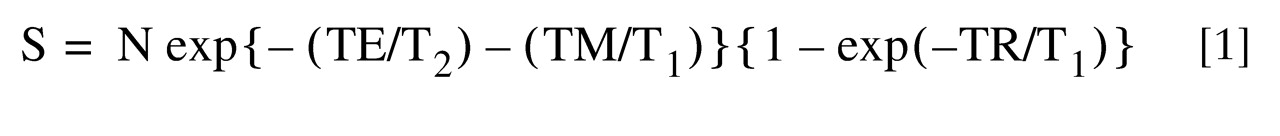
):
where N represents the number of metabolite molecules per unit voxel. By fitting S and TR (or TE) values to equation 1 at constant TE (or TR), metabolite T1 (or T2) values were obtained for the three Down’s syndrome brains, the three comparison brains, and the standard solution.
From equation 1 we can derive
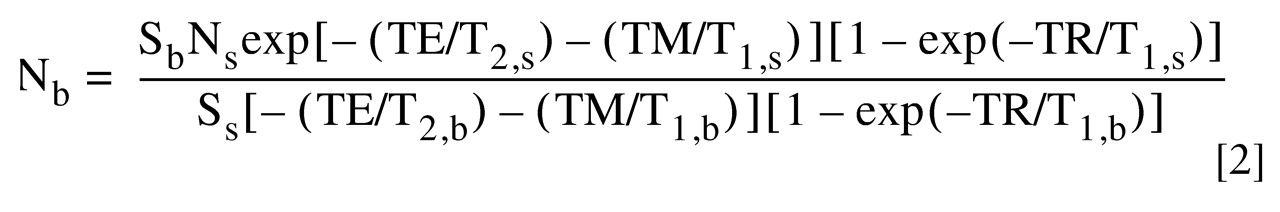
to calculate any metabolite molecule numbers per unit voxel in either Down’s syndrome or comparison brain:
where the subscripts s and b represent standard and brain, respectively.
To obtain accurate brain metabolite concentrations, [Met
b], in millimoles per liter of wet brain tissue, the CSF volume fraction, f
CSF, in the spectroscopic voxels must be corrected. By using an algorithm developed by DeCarli and co-workers
(30), the volumetric images covering the spectroscopic slice thickness were segmented to determine the CSF volume fraction in each voxel. Therefore, brain metabolite concentrations were calculated as in

:
where Vvoxel is the volume of a spectroscopic voxel (8.0 cm3).
Statistical Analysis
We tested group differences in demographic characteristics by means of t tests and chi-square tests as appropriate. Group differences in metabolite concentrations were tested by means of two-way analysis of variance (ANOVA) with group and age group as the between-subjects factors. Findings of significant ANOVA interaction effects were followed by analyses of simple effects by means of protected t tests.
RESULTS
Because no significant difference was observed in T
1 or T
2 values between the occipital and parietal regions within the same subject group, the mean T
1 and T
2 values used in equation 2 for concentration calculations were averaged across the measurements from both regions for the comparison and Down’s syndrome subjects, respectively. Our T
1 and T
2 values for the brains of comparison subjects and for standard solution agree well with values reported in the literature
(15,
31,
32).
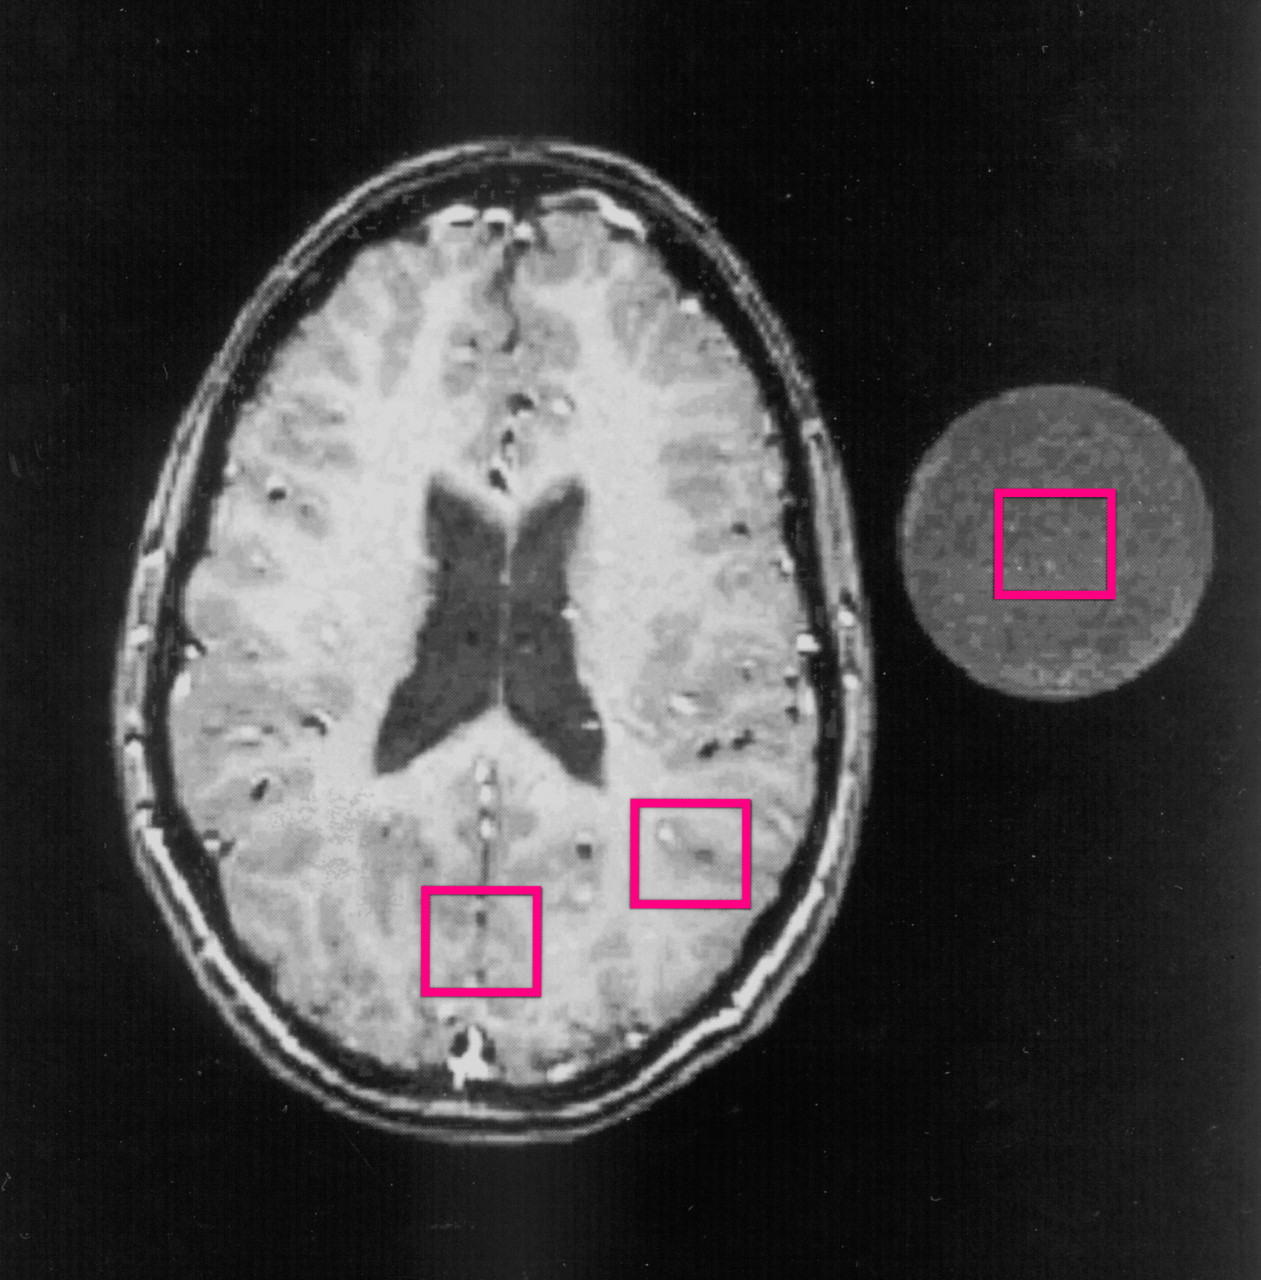
Figure 2 shows representative
1H MR spectra from the occipital region. These spectra from representative individuals clearly illustrate higher levels of
myo-inositol and choline-containing compounds in this region in both young and old Down’s syndrome subjects than in representative age-matched comparison subjects. However, in these spectra, the significant differences in
N-acetylaspartate and total creatine, if any, are not easily seen by examining the peak amplitudes of these two metabolites.
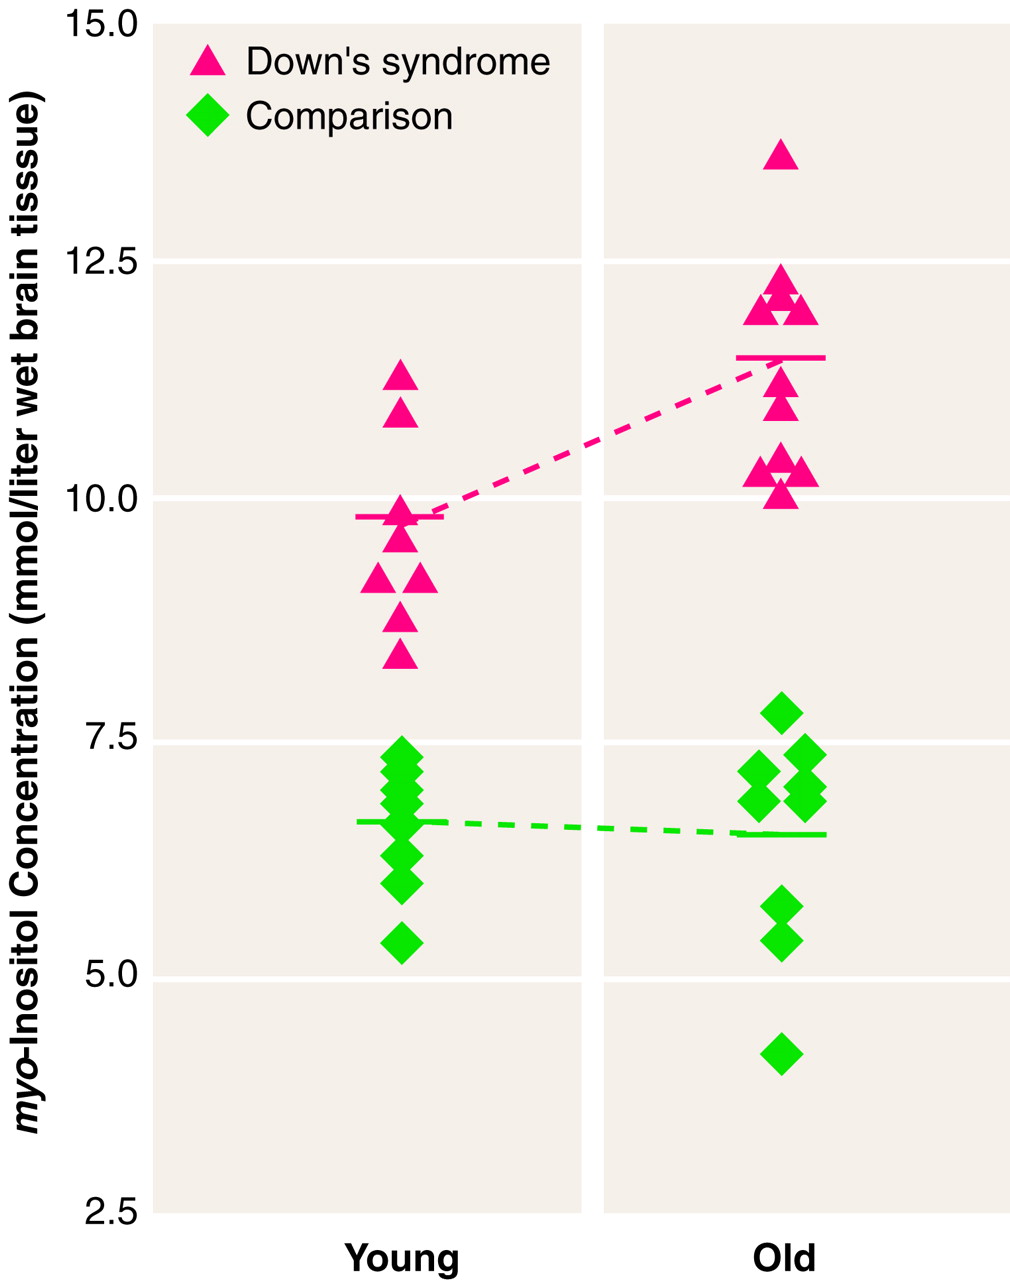
table 1 lists the means and standard deviations of brain metabolite concentrations in both the occipital and parietal regions of interest, as calculated from equation 3 for both age groups of nondemented Down’s syndrome and healthy comparison subjects. For each of the four compounds, the Down’s syndrome and comparison groups differed in both regions of interest. Compared with the healthy subjects, the adults with Down’s syndrome had significantly higher levels of
myo-inositol (mean difference: 61% higher in occipital region, 55% higher in parietal region), choline-containing compounds (54% higher in occipital region, 45% higher in parietal region), and total creatine (9% higher in occipital region, 8% higher in parietal region) and a significantly lower concentration of
N-acetylaspartate (17% lower in occipital region, 9% lower in parietal region). Significant main effects of age were shown for brain
N-acetylaspartate,
myo-inositol, and choline-containing compounds. In comparison to the younger subjects, the older comparison and Down’s syndrome subjects combined had significantly lower
N-acetylaspartate levels and higher
myo-inositol concentrations in both regions and a significantly higher concentration of choline-containing compounds in the parietal region.
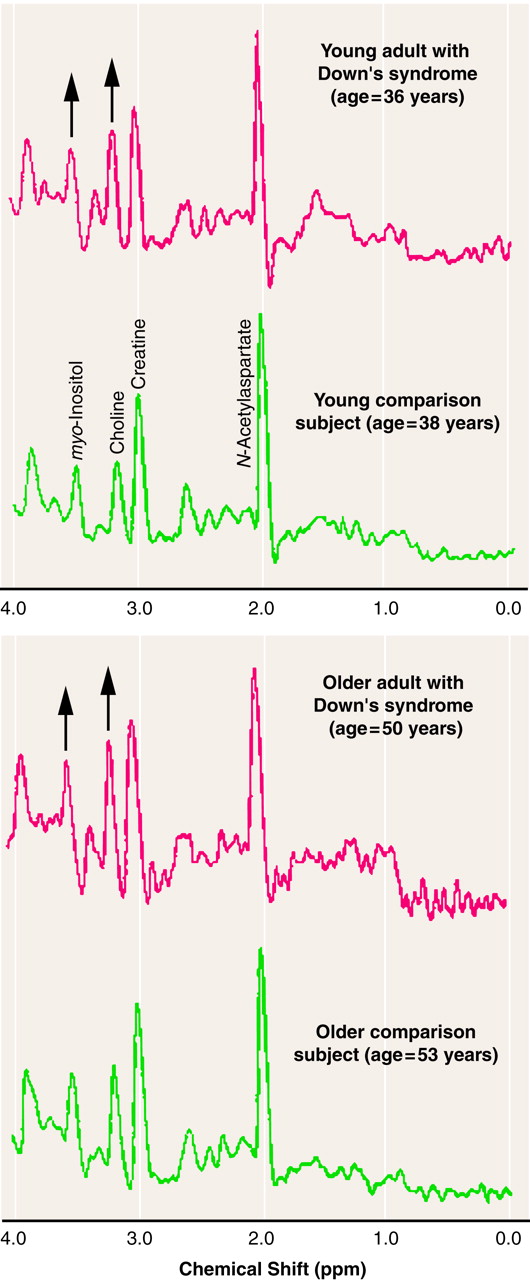
There was a significant group-by-age interaction for
myo-inositol in the occipital region (
table 1 and
figure 3) and for total creatine in both regions (
table 1). Follow-up analysis of simple effects using pairwise t tests showed that the group of older adults with Down’s syndrome had higher levels of
myo-inositol and total creatine than the younger Down’s syndrome subjects, whereas no age difference was observed for these metabolites in these regions in the healthy comparison subjects. Further, the older Down’s syndrome subjects had higher concentrations than the older comparison subjects for
myo-inositol in the occipital region and for total creatine in both regions; the younger Down’s syndrome subjects had higher
myo-inositol levels in the occipital area than the younger comparison subjects, but no significant difference between the young Down’s syndrome and comparison subjects was found for total creatine. Finally, the
myo-inositol level remained higher after we controlled for total creatine (analysis of covariance: F=4.54, df=1, 25, p<0.04).
DISCUSSION
Our measurements with in vivo
1H MRS of absolute concentrations of
myo-inositol extend results from previous studies showing high brain levels of
myo-inositol in Down’s syndrome. As there is no evidence of abnormal gliosis or osmotic imbalance in the brains of young adults with Down’s syndrome, the approximately 50% higher
myo-inositol level supports a gene dose effect of the extra chromosome 21, by which three copies of a gene, rather than the normal two copies, may be expected to produce 50% more gene activity or product. The human osmoregulatory sodium/
myo-inositol cotransporter gene has been localized to the distal portion of this chromosome
(33). Further, greater uptake of
myo-inositol in cultured neurons (1.4 times normal)
(34) and skin fibroblasts (2–3 times normal)
(35) in Down’s syndrome and a greater than normal maximum velocity of high-affinity inositol transport suggest a higher than normal number of equivalent high-affinity inositol transporters in Down’s syndrome
(35). It appears that there normally are efficient intracellular systems to maintain inositol homeostasis, by the recycling of membrane phosphatidylinositol, de novo synthesis from glucose-6-phosphate, and active transport from extracellular tissues. It is likely that the higher brain
myo-inositol level is related to greater transport of
myo-inositol in Down’s syndrome.
In addition to the significant group difference in
myo-inositol between Down’s syndrome and healthy subjects, the older Down’s syndrome subjects in the preclinical stages of Alzheimer’s disease also had a significantly higher
myo-inositol level than was found in the younger Down’s syndrome subjects. Because of the wide age range of our subjects, we were able to show such a difference, in addition to an effect of Down’s syndrome. Although an age effect cannot be excluded, it seems most likely that the difference between younger and older Down’s syndrome subjects represents an effect of Alzheimer’s disease, since neuropathological studies have shown that all brains from persons with Down’s syndrome over age 40 years have Alzheimer’s disease neuropathology
(4). Our finding extends to the predementia phase the
1H MRS results from demented subjects with Alzheimer’s disease that show significantly higher than normal concentrations of brain
myo-inositol
(15–
18). Although our previous CSF studies showed nonsignificant differences in
myo-inositol between older and younger adults with Down’s syndrome and between Alzheimer’s disease and comparison subjects, the smaller differences in CSF may be due to the inability of CSF to reflect regional effects. If the higher
myo-inositol level is localized to certain regions, then the contributions to the CSF of regions that do not show high
myo-inositol levels may minimize the effect of high
myo-inositol levels in the affected regions.
It was expected that the parietal region, rather than the occipital area, would show early effects of Alzheimer’s disease, since the neuropathology of Alzheimer’s disease typically affects association parietal cortex more than primary occipital cortex. That the opposite was shown for myo-inositol concentrations may be related to the unexplained differences between the values in the parietal and occipital regions of interest for the young comparison group. Within the Down’s syndrome group, the older subjects’ myo-inositol levels were higher than those of the young subjects by equal mean magnitudes in the parietal and occipital regions, suggesting that both regions show early effects of Alzheimer’s disease in Down’s syndrome.
The neurobiological importance of the high
myo-inositol levels in older Down’s syndrome subjects and Alzheimer’s disease patients remains to be determined. It has been reported that glia contain much higher concentrations of
myo-inositol
(36). Loss of neurons with resultant gliosis could hypothetically cause the increase in
myo-inositol observed in older Down’s syndrome subjects, as well as the elevation in creatine, which has higher concentrations in astrocytes than neurons
(37). This possibility is supported by reports of high
myo-inositol concentrations in frontotemporal dementia
(16,
17), suggesting that high
myo-inositol levels may not be specific for Alzheimer’s disease but rather a marker of gliosis. After we controlled for creatine, we found that the
myo-inositol level remained high, suggesting that the high
myo-inositol concentration in the older Down’s syndrome group is less likely to be solely due to a nonspecific gliotic process. One study
(20) showed that the concentration of phosphatidylinositol was significantly less than normal in Alzheimer’s disease, although this was not found in another study
(38). Defects in postsynaptic intracellular signal transduction have been reported in Alzheimer’s disease
(39), and it is possible that these defects coexist with abnormalities in intracellular systems for inositol homeostasis.
Unlike others who have performed MRS studies of Alzheimer’s disease, we examined the predementia phase. The study of this phase for the early diagnosis of Alzheimer’s disease is important for at least two reasons. First, although each genetic mutation is associated with a particular age at onset, there may be wide variation. If genotyping could be combined with a phenotypic test of early disease activity, this might help to determine an individual’s genotype-specific age at dementia onset. Second, interventions with medications to boost neurotransmitter function have had limited success, suggesting that the loss of synapses that occurs in Alzheimer’s disease may be too great to allow for effective therapy. It would therefore be important to diagnose Alzheimer’s disease in the earliest stages, when the disease may be most treatable. Measurement of markers of disease activity such as myo-inositol may allow such an early diagnosis.
Another metabolite that has been studied in Down’s syndrome is choline, which serves as a precursor of the major choline-containing membrane phospholipids, phosphatidylcholine and sphingomyelin, and of acetylcholine
(40). The high concentration of choline-containing compounds in our Down’s syndrome group shown by
1H MRS highlights our previous report of a high choline level in CSF, but not plasma, in adults with Down’s syndrome
(41). Membrane phosphatidylcholine contains most of the choline in the brain, but choline in phosphatidylcholine is not detectable by
1H MRS because the large size of phosphatidylcholine limits its movement. Rather, the MRS-visible compounds, which include choline, phosphocholine, cytidine diphosphate choline, glycerophosphocholine, and acetylcholine, appear to be markers of changes in brain choline metabolism and phosphatidylcholine turnover
(42). Choline supplies in the brain are maintained by facilitated choline diffusion across the blood-brain barrier and choline recycling from membrane turnover of phosphatidylcholine. The genetic mechanisms that regulate choline homeostasis are unknown. However, an approximately 50% higher level of MRS-visible choline compounds is consistent with a gene dose effect, indicating that choline regulation may be associated with a gene locus on chromosome 21.
Unlike
myo-inositol, choline-containing compounds did not show a group-by-age interaction. Although this finding differs from the results of Murata et al.
(25), they examined a white matter region in a younger Down’s syndrome group. Our results are consistent with those of most MRS studies of Alzheimer’s disease, which do not show high levels of choline-containing compounds.
Several studies have shown that there is not a greater generalized loss of brain mass or increase in CSF space with age in nondemented adults with Down’s syndrome than in healthy comparison subjects
(43–
47). That we did not observe an age-by-group effect on
N-acetylaspartate in the Down’s syndrome and comparison subjects is consistent with evidence against neuronal cell death or mitochondrial dysfunction in the neocortex during the preclinical stages of Alzheimer’s disease, and it further supports results of previous studies suggesting that older Down’s syndrome adults without nonmemory cognitive impairment can maintain normal resting brain metabolism for many years
(10). At least one study of Alzheimer’s disease also did not show a low level of
N-acetylaspartate in the neocortex
(17). This suggests that
N-acetylaspartate may need to be measured in the limbic or medial temporal region (the sites of earliest disease in Alzheimer’s disease) during the preclinical stages of Alzheimer’s disease
(48). Further, the lack of change in
N-acetylaspartate in the neocortex suggests that
myo-inositol may be a more sensitive marker of the disease process than
N-acetylaspartate before the onset of dementia in Down’s syndrome.
This study shows that the technique of 1H MRS can be used to measure absolute brain metabolite concentrations in vivo and noninvasively. The use of absolute measurement avoids the problem of ratio normalization, by which a change in the denominator without a change in the numerator may result in an artifactual group difference. This was particularly important, as we observed higher total brain creatine levels in the Down’s syndrome subjects than in the comparison group. Normalizing metabolite levels to total brain creatine concentration, as is commonly done, might lead to underestimation of other metabolites in Down’s syndrome.
The average brain concentrations of the four metabolites in our healthy comparison subjects agree fairly well with results from other quantitative in vivo MRS measurements
(29,
31,
49). In comparing our absolute values of
myo-inositol and choline-containing compounds to normative values from autopsy studies, one also finds close agreement. For example, we found
myo-inositol values of 6.5 mmol/liter wet brain tissue (SD=1.0) in the occipital region and 6.3 mmol/liter (SD=1.0) in the parietal region in our group of older healthy comparison subjects by means of MRS. Another team of investigators
(50) reported an inositol level of 6.0 mmol/kg wet brain at age 20 years, which declined by 50% by age 90 years, but they later found a value of 5.1 mmol/kg (SD=3.1) in 18 subjects with a mean age of 78.4 years (SD=6.9) when using a different method
(20). Nitsch et al.
(38) reported the sum of the concentrations of glycerophosphocholine, phosphocholine, and choline (the major components in the MRS signal for choline-containing compounds) as 1.50 mmol/kg wet tissue (SD=0.21) in the frontal cortex from 10 comparison subjects, whereas we found concentrations of choline-containing compounds of 1.8 mmol/liter wet brain tissue (SD=0.2) in the occipital region and 1.8 mmol/liter (SD=0.1) in the parietal region in our younger healthy comparison subjects.
Our finding of a 50% higher absolute concentration of myo-inositol in Down’s syndrome suggests a gene dose effect of the extra copy of the human osmoregulatory sodium/myo-inositol cotransporter gene located on chromosome 21, resulting in increased transport of myo-inositol into the brain in Down’s syndrome. The even higher myo-inositol level in older people with Down’s syndrome suggests that 1H MRS may offer a method for distinguishing subjects in the preclinical stages of Alzheimer’s disease.