Atypical antipsychotics may offer better control of negative and cognitive symptoms of schizophrenia, and they have markedly lower liability for extrapyramidal symptoms, compared with conventional agents
(1). However, weight gain has emerged as an important tolerability issue with some of the atypical agents
(2).
Ziprasidone has established efficacy in short- and long-term placebo-controlled trials and has demonstrated comparability to haloperidol
(3–
8). Ziprasidone is a potent antagonist of both serotonin 5-HT
2A and dopamine D
2 receptors, although its affinity for 5-HT
2A receptors is about 10 times higher than for D
2 receptors. It also has affinity for 5-HT
1A, 5-HT
1B/1D, and 5-HT
2C receptors
(9). It is a moderately potent blocker of both serotonin and norepinephrine reuptake. Ziprasidone has moderate α
1-adrenergic and histaminergic activity, and negligible activity at muscarinic cholinergic receptors.
Ziprasidone has exhibited a low incidence of weight gain
(3,
4,
6,
8), and one analysis suggested it carries a lower liability for weight gain than other atypical agents
(2). In an open-label study, patients whose medication was switched to ziprasidone from conventional antipsychotics, risperidone, or olanzapine exhibited improvement in the lipid profile
(10). Ziprasidone has also demonstrated a low incidence of extrapyramidal symptoms
(6) and a low risk of prolactin elevation
(8). It has been associated with modest prolongation (<10 msec) of the corrected QT (QTc) interval on ECGs obtained during short-term, fixed-dose, placebo-controlled trials evaluating doses of up to 200 mg/day
(11). A study evaluating QTc intervals at maximum steady-state plasma concentrations demonstrated a 9–14-msec greater increase in QTc interval with ziprasidone than with four other atypical antipsychotics, including olanzapine (package insert for Geodon [ziprasidone], Pfizer Inc., New York, 2002). The clinical relevance of this magnitude of change is unclear. No excess risk of cardiac sequelae was observed in the clinical development program (package insert for Geodon [ziprasidone], Pfizer Inc., New York, 2002).
Olanzapine is among the best studied and most widely used of the atypical agents. Comparisons with placebo
(12,
13) and haloperidol
(13,
14) have demonstrated the antipsychotic efficacy of olanzapine, with low liabilities for both extrapyramidal symptoms and sustained elevations in prolactin
(15–
20).
However, long-term experience with olanzapine has engendered concerns about possible metabolic effects and their consequences. Olanzapine has been associated with the greatest liability for weight gain among first-line antipsychotics
(2,
21–26). Obesity is common in schizophrenia, and individuals with the disease appear to be at higher risk for obesity-related conditions, including type II diabetes and cardiovascular disease
(27). Weight gain may also be a limiting factor for adherence to antipsychotic therapy
(21). Moreover, evidence has accumulated, mainly from case reports, case series, and retrospective analyses, of other untoward metabolic alterations associated with olanzapine. A study monitoring lipid profiles in olanzapine-treated inpatients found significantly increased serum triglyceride levels
(28), and cases of severe hyperlipidemia (>600 mg/dl) associated with olanzapine have been reported
(29). Impaired glucose regulation, manifesting as new-onset or exacerbated diabetes
(30–
33) or diabetic ketoacidosis
(32,
34), has also been described in patients receiving the drug, and these reports have been reviewed in detail
(35). An analysis of data from the Department of Veterans Affairs found that among 38,000 patients with schizophrenia who were being treated with antipsychotics, there was a significantly higher odds ratio of a diagnosis of diabetes in patients receiving olanzapine, relative to those receiving typical antipsychotics, with the highest odds ratio in patients younger than age 40 years
(36).
We conducted a 6-week, flexible-dose trial to compare the tolerability and efficacy of ziprasidone and olanzapine in acutely ill, recently admitted inpatients with a primary psychiatric diagnosis of schizophrenia or schizoaffective disorder. We also evaluated the metabolic profiles of both agents.
Method
Study Design
The study was a 6-week, multicenter, double-blind, parallel-design, randomized, controlled trial in inpatients.
Inclusion and Exclusion Criteria
The trial included men and women age 18–55 years. Female patients were required not to be of childbearing potential. Patients were to have been hospitalized for no more than 2 consecutive weeks immediately before screening. Patients were required to have a primary diagnosis of schizophrenia or schizoaffective disorder (any subtype, chronic or subchronic) as defined in DSM-IV (diagnostic codes 295.X or 295.70) and persistent psychotic symptoms for the week before hospital admission. At screening, patients were required to have score ≥4 on the Clinical Global Impression (CGI) severity scale and a score ≥4 on at least one of the following Positive and Negative Syndrome Scale
(37) positive symptom items: delusions, conceptual disorganization, or hallucinatory behavior. At baseline, patients were required to have a score ≥4 on the CGI severity scale and ≥3 on the CGI improvement scale, compared with the screening score. At baseline, patients were also required to meet the criteria for the Positive and Negative Syndrome Scale positive symptom items that had been used in the screening.
Patients were required to have normal laboratory test results and normal ECG results, and to have negative results on a urine drug screen at study entry.
Patients with primary DSM-IV axis I psychiatric disorders other than schizophrenia or schizoaffective disorder or DSM-IV-defined psychoactive substance abuse/dependence in the preceding 3 months were excluded. Patients whose depot neuroleptic medication had been discontinued were eligible only after an average dosing period had elapsed.
Patients who did not respond to two adequate treatment trials with antipsychotic medications in the past year were excluded. Patients judged by the investigator as being at significant risk of suicide, violent behavior, or homicide were excluded. Also excluded were patients with >14 days’ total lifetime exposure to olanzapine, those who had received a daily olanzapine dose >10 mg, and those who had discontinued use of this drug due to lack of efficacy or an adverse event.
Written informed consent was obtained from all patients.
Treatment
Patients began with a 1–3-day screening period, followed by a 1-day baseline period, during which psychotropic medications were discontinued and neurocognitive testing and other baseline assessments were carried out. After random assignment to treatment groups in a 1:1 ratio, patients received a fixed dose of their assigned study drug for the first week of treatment. Medication blister card labels of double-blind medication included the strength (labeled as “A,” “B,” and “C” corresponding to “low,” “medium,” and “high,” respectively), protocol number, week number, the date dispensed, the patient’s initials, and the randomization numbers. Fixed dosing regimens were used during week 1 only (ziprasidone: 40 mg b.i.d. on days 1 and 2, 80 mg b.i.d. on days 3–7; olanzapine: 5 mg/day on days 1 and 2, 10 mg/day on days 3–7). Dosage was flexible during weeks 2–6 (ziprasidone: 40, 60, or 80 mg b.i.d.; olanzapine: 5, 10, or 15 mg/day). During weeks 3–6, patients remained as inpatients unless they met all protocol criteria for hospital discharge.
Lorazepam was permitted for control of agitation or insomnia, and benztropine was permitted for control of extrapyramidal symptoms.
Efficacy Evaluations
Baseline efficacy evaluations were made with the Brief Psychiatric Rating Scale (BPRS), Positive and Negative Syndrome Scale, CGI severity scale, and CGI improvement scale. Assessments were performed at baseline and weeks 1–6 or at early termination (endpoint). The Positive and Negative Syndrome Scale was administered at weeks 1, 3, and 6 or at endpoint. The BPRS, CGI severity scale, and CGI improvement scale were given weekly through endpoint, and the Calgary Depression Scale for Schizophrenia (http://www.ucalgary.ca/cdss/) was administered at weeks 3 and 6 or at endpoint.
Safety and Tolerability Evaluations
Adverse events
All observed or volunteered adverse events, regardless of treatment group or suspected causal relation to the study drugs, were recorded. The severity, duration, and possible relation to the study drugs of all adverse events were also recorded.
Movement disorders
Dystonic movements were recorded as adverse events. Evaluations with the Extrapyramidal Symptom Rating Scale
(38) (primarily for the rating of parkinsonism) and the Barnes akathisia scale (for the rating of akathisia)
(39) were performed at baseline, day 21, and day 42 or at endpoint. The Abnormal Involuntary Movement Scale (AIMS) evaluation
(40) was performed at baseline and day 42 or at endpoint.
Body weight and body mass index
Body weight was measured at screening, baseline, during each study week, and after 6 weeks of treatment or at endpoint. Body mass index was determined at baseline and after 6 weeks of treatment or at endpoint.
Clinical Laboratory Parameters
The following tests were performed at screening and day 42 (end of study) or at endpoint: CBC with differential and platelet count, urinalysis, and blood chemistry (levels of calcium, inorganic phosphorus, sodium, potassium, chloride, lactate dehydrogenase aspartate aminotransferase, total bilirubin, alanine aminotransferase, alkaline phosphatase, cholesterol, triglycerides, total protein, globulin, albumin, blood urea nitrogen, creatinine, uric acid, and glucose).
Serum lipid profile
Fasting levels of serum lipids were assessed. Fractionated serum lipids (total cholesterol, low-density lipoprotein [LDL] cholesterol, and high-density lipoprotein [HDL] cholesterol) were measured at screening and after 6 weeks of treatment or at endpoint. Levels of apolipoproteins A-I and B, lipoprotein (a), homocysteine, and remnant lipoprotein were assessed at screening and after 6 weeks of treatment or at endpoint.
Glucose and insulin
Fasting serum glucose, fasting insulin, C-peptide, and homeostasis model assessment insulin resistance (logarithm) (HOMA-IR [log]) were assessed at screening and after 6 weeks of treatment or at endpoint. HOMA-IR (log), originally described by Matthews et al.
(41), takes into account both fasting insulin and fasting glucose measurements (defined as [fasting insulin × glucose]/22.5). This method has been supported through correlation of its results with those of the euglycemic-hyperinsulinemic clamp method of measurement in diabetic
(42,
43) and nondiabetic
(43) individuals.
Vital Signs
Vital signs were taken at screening, baseline, during each study week, and after 6 weeks of treatment or at endpoint. All patients underwent ECG evaluations at screening and at the end of week 6 or at endpoint.
Statistical Methods
It was estimated that 130 patients per group would be an adequate number to demonstrate treatment equivalence in the BPRS total score with the margin of 3.5 points, by using a one-sided test at a 2.5% significance level and 80% power (nQuery Advisor Release 3.0; Statistical Solutions, Saugus, Mass.). Inferential analysis was thus based on a one-sided upper 97.5% confidence interval (CI) for the treatment difference corresponding to the noninferiority hypothesis test at α=2.5%
(44).
Inferential analyses on the efficacy and tolerability variables were based on change from baseline to endpoint (week 6 or early discontinuation) for all patients. This analysis included all patients who received at least one dose of study medication and had a baseline and postbaseline observation. For completer analyses, only patients who completed the study to its last scheduled visit were included. All endpoint analyses used the last-observation-carried-forward approach, that is, the last available visit was used as the endpoint. Efficacy analyses based on the last inpatient visit were also performed (by using the last inpatient observation before the patient became eligible for hospital discharge). All tests of hypotheses were performed at the 5% significance level by using an intent-to-treat analysis.
Inferential analyses of change from baseline in the primary efficacy measure of the BPRS total score were based on an analysis of covariance model (ANCOVA) with terms for treatment, center, and baseline values. This model was used to estimate least squares mean changes for ziprasidone and olanzapine. Equivalence of the two treatment groups in the BPRS total score was demonstrated if the two-sided 95% CI of the least squares mean difference (the least squares mean change for ziprasidone minus the least squares mean change for olanzapine) included zero and remained within the a priori specified margins of 3.5 points or less.
Inferential analyses for the CGI severity scale score and the secondary efficacy measures (Calgary Depression Scale for Schizophrenia score, Positive and Negative Syndrome Scale total, positive, and negative scores) were likewise analyzed by using an ANCOVA model. Categorical analyses of CGI improvement scale scores, stratified by center, were performed with the Cochran-Mantel-Haenszel method (with ridit scoring). Responder rates (last observation carried forward) based on achieved reductions in the BPRS total score of 20%, 30%, and 40% from baseline to endpoint were likewise evaluated with the Cochran-Mantel-Haenszel method. The last-observation-carried-forward, by-visit analyses of changes in BPRS total and CGI severity scale scores were conducted for all patients by using ANCOVA.
For patients in each treatment group, discontinuation of treatment was recorded, and the primary reason for discontinuation was determined and summarized. All observed or volunteered adverse events occurring during treatment or within 6 days after the last day of treatment were tabulated by treatment group (by using the Coding Symbols for Thesaurus of Adverse Reaction Terms [COSTART] dictionary
[45]). Data on adverse events included whether the event was treatment emergent (events that either were not present at baseline and emerged after treatment with the study drug or were present at baseline and worsened in severity during treatment), the body system affected, the preferred term for the event from the COSTART dictionary, the investigator’s assessment of severity (mild, moderate, severe), and the investigator’s assessment of the event’s relationship to the study medication.
Inferential analyses for change from baseline to endpoint for all patients (last observation carried forward) in movement disorder measures (Extrapyramidal Symptoms Rating Scale, Barnes akathisia scale, and AIMS scores), body weight, and body mass index were performed by using ANCOVA, with terms for treatment, center, and baseline values. Mean changes from baseline to endpoint in QTc interval were summarized by treatment group. The QTc intervals were calculated by using the formula QTc=QT/RR**0.4, where RR=heart rate/60 (the expression “RR**0.4” indicates RR raised to the 0.4th power). Differences between the two groups in mean change in QTc interval were analyzed with a two-tailed t test.
For laboratory parameters, changes from baseline to endpoint (week 6 or early termination) in all patients were compared between treatment groups by using the Wilcoxon rank sum test and rank ANCOVA for baseline adjustment. The significance of change within each treatment group was tested by using the Wilcoxon matched-pairs signed ranks test. Inference analyses were also performed for HOMA-IR (log).
Results
Demographic and Clinical Characteristics of Patients
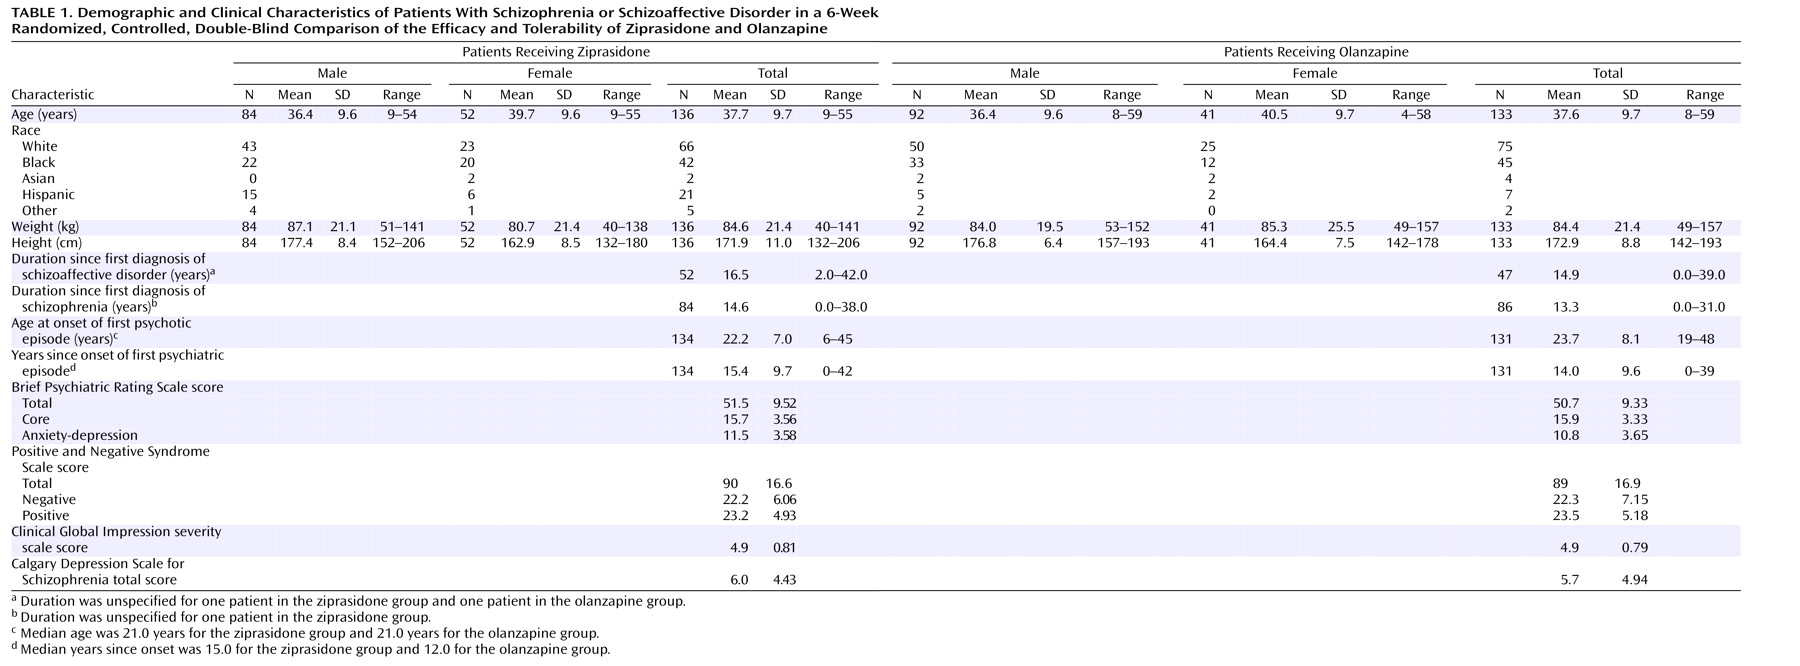
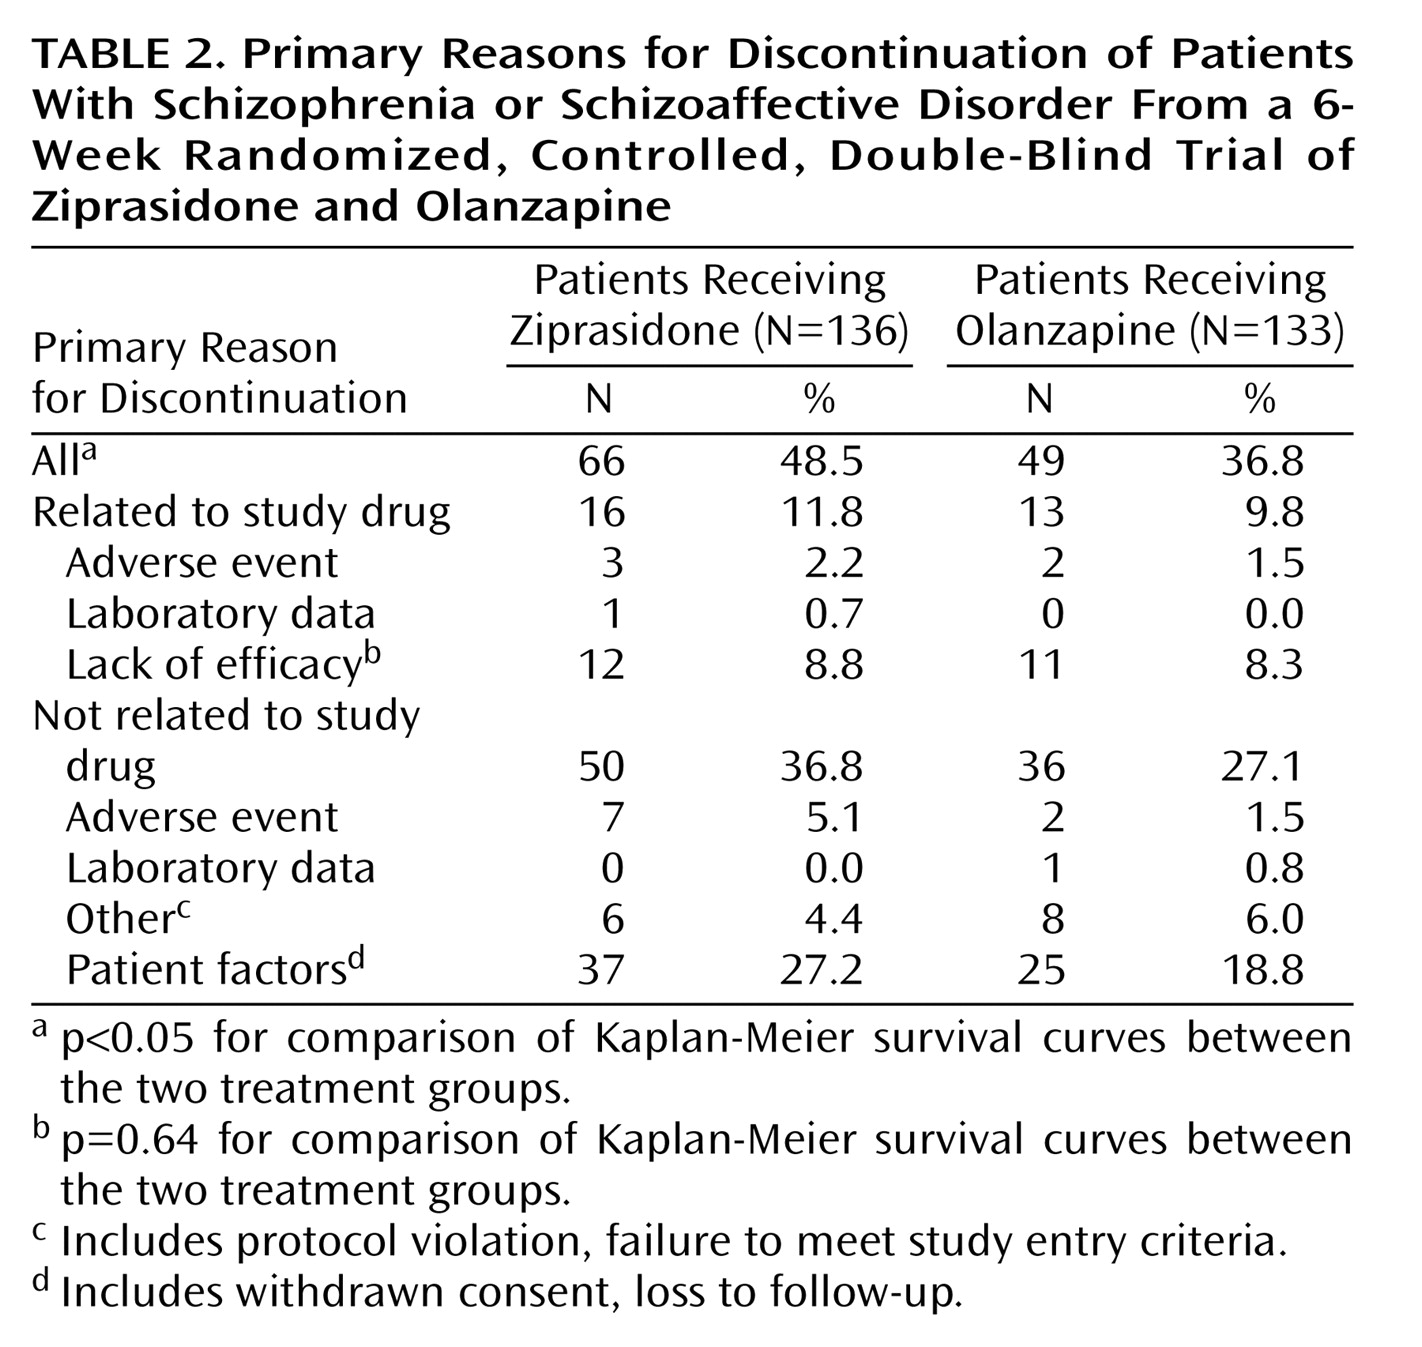
Three hundred sixty-seven patients were screened for entry, and 269 were randomly assigned to treatment and received at least 1 dose of the study drug. Of the 136 patients assigned to receive ziprasidone, 51.5% (N=70) completed the study and 48.5% (N=66) discontinued. Of the 133 patients assigned to receive olanzapine, 63.2% (N=84) completed the study and 36.8% (N=49) discontinued. The patients’ demographic and baseline clinical characteristics are summarized in
Table 1. There were no notable imbalances between treatment groups in the distribution of diagnoses (schizophrenia or schizoaffective disorder) or duration of disease. A greater percentage of patients randomly assigned to receive olanzapine were male (69%, compared with 62% of the patients randomly assigned to receive ziprasidone), but this difference was not statistically significant. Discontinuation rates and reasons for discontinuation are listed in
Table 2. The Kaplan-Meier estimate of the cumulative discontinuation rate was significantly higher with ziprasidone (p<0.05), but there were no significant differences between the groups in rates of discontinuation due to lack of efficacy. There were only three discontinuations due to treatment-related adverse events in the ziprasidone group and two such discontinuations in the olanzapine group. The most common reason for discontinuation in both groups was a patient factor not related to the study drug (e.g., protocol violation, loss to follow-up), and the rate of these discontinuations was numerically higher for ziprasidone.
Dosing
This was a flexible-dose study, in which investigators were allowed to assign doses according to clinical judgment within the permissible range. The overall mean daily doses were 129.9 mg (SD=27.3) for ziprasidone and 11.3 mg (SD=2.8) for olanzapine; the overall median daily doses were 138.6 mg for ziprasidone and 12.4 mg for olanzapine. After week 5, the mean daily doses were 139.0 mg (SD=24.7) for ziprasidone and 13.0 mg (SD=3.1) for olanzapine.
Concomitant Medications
In the ziprasidone group, 96 patients (70.6%) had been receiving lorazepam at baseline, and 113 (83.1%) were treated with this agent during the study. In the olanzapine group, 94 patients (70.7%) were receiving lorazepam at baseline, and 100 (75.2%) received it during the study. In both groups, all patients who received lorazepam during the study started the medication during the first week of the study.
In the ziprasidone group, 43 patients (31.6%) were receiving benztropine at baseline, and 34 (25.0%) received it during the study. Among olanzapine-treated patients, 64 (48.1%) were receiving benztropine at baseline, and 20 (15.0%) received it during the study. In both groups, all patients who received benztropine during the study started the medication during the first week of the study, and benztropine use decreased by study visit.
Efficacy
BPRS total score
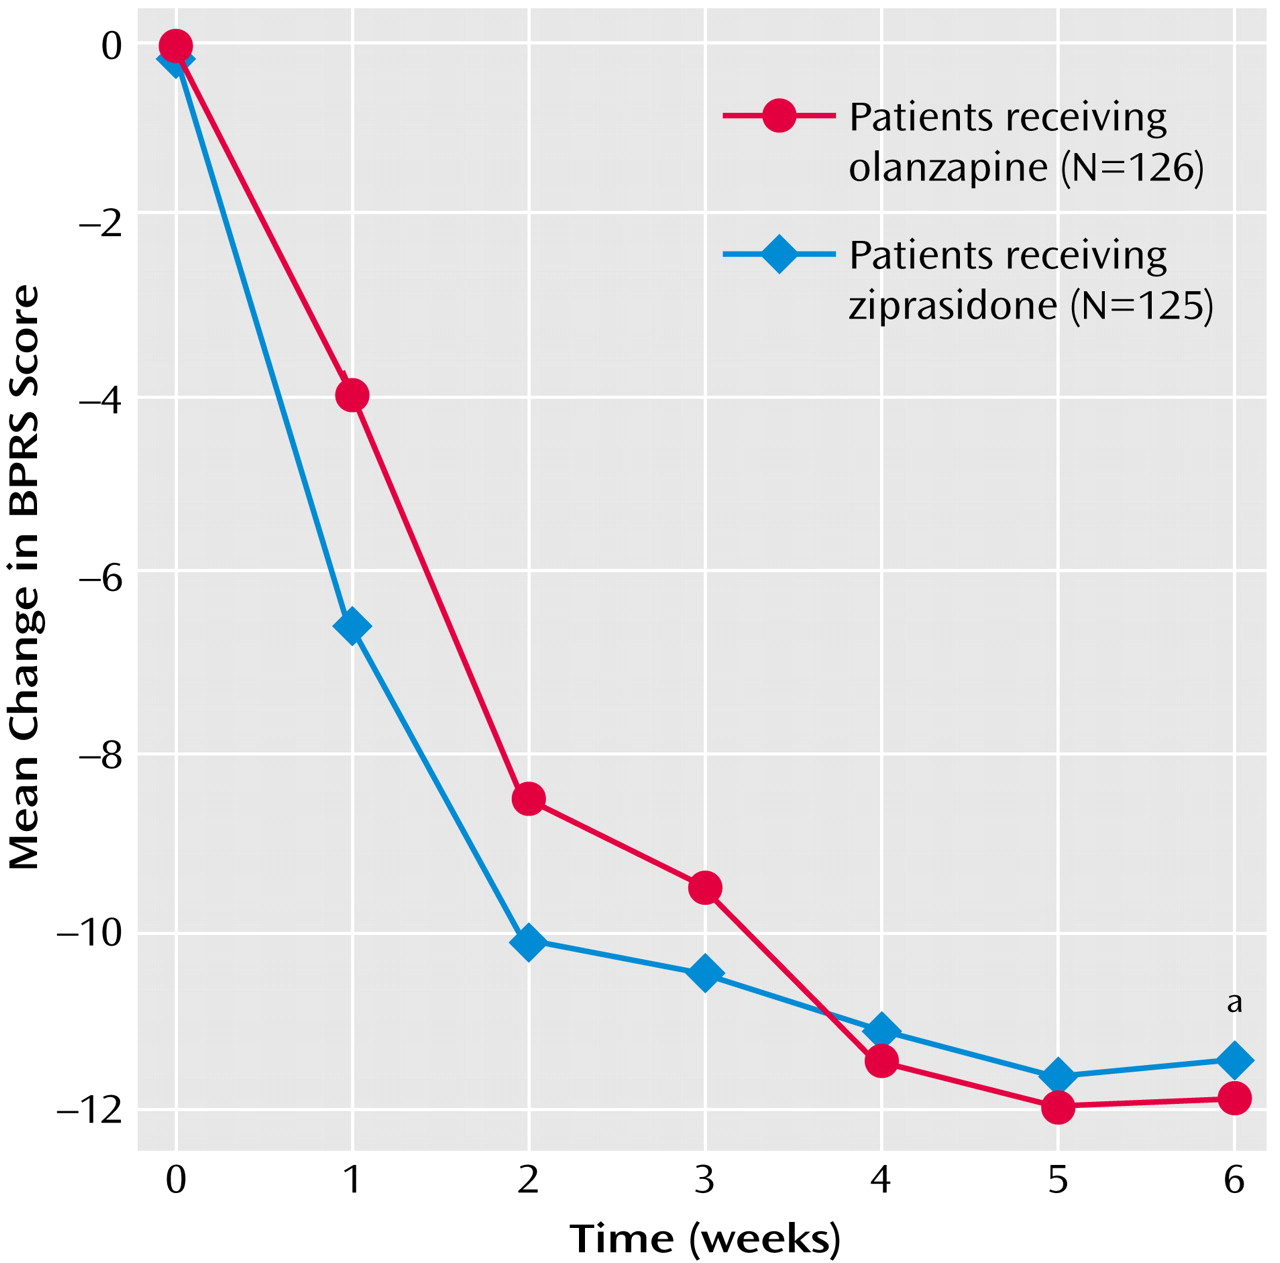
BPRS total scores at baseline were similar for the patients treated with olanzapine and those treated with ziprasidone; both treatments were associated with improved BPRS total scores during the 6-week study (
Figure 1), and there were no significant differences between treatments at either the last inpatient visit (p=0.63, 95% CI=–3.46 to 2.13) or at endpoint (p=0.77, 95% CI=–2.36 to 3.18). These confidence intervals for differences in least squares mean change (ziprasidone minus olanzapine) included zero and remained within the a priori specified margin of 3.5 points, demonstrating that ziprasidone was as effective as olanzapine in improving the BPRS total score. The last-observation-carried-forward, by-visit analysis indicated progressive improvement in the BPRS total score with both treatments, with no significant difference between groups except at day 7, when the ziprasidone group demonstrated greater improvement than the olanzapine group (p<0.008, ANCOVA). Sixty-six (53%) ziprasidone-treated patients and 71 (56%) olanzapine-treated patients demonstrated ≥20% improvement from baseline at endpoint, 45 (36%) ziprasidone-treated patients and 50 (40%) olanzapine-treated patients demonstrated ≥30% improvement, and 26 (21%) ziprasidone-treated patients and 32 (25%) olanzapine-treated patients demonstrated ≥40% improvement. Responder rates did not differ significantly between the treatment groups. Similar results were obtained for the completer population.
CGI severity scale
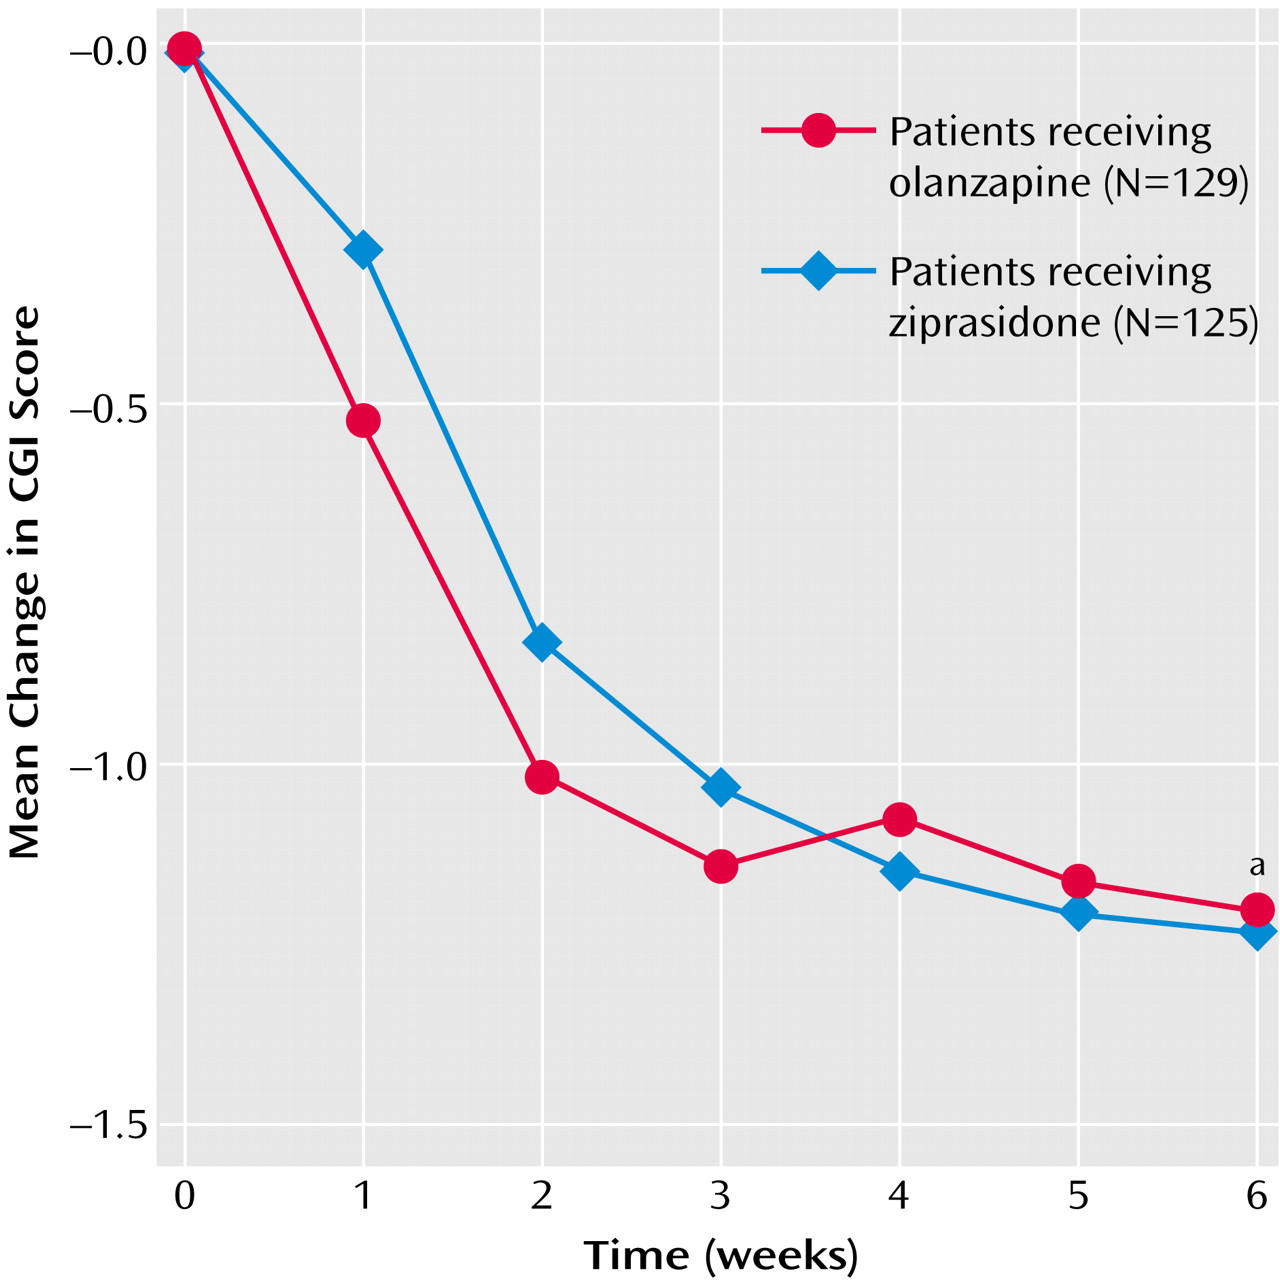
Patients in the two treatment groups had similar CGI severity scale scores at baseline, and both treatments improved the CGI severity scale score, with no significant between-group difference at either the last inpatient visit (p=0.74, 95% CI=–0.31 to 0.22) or at endpoint (p=0.95, 95% CI=–0.27 to 0.29) (
Figure 2). Confidence intervals for differences in least squares mean change (ziprasidone minus olanzapine) in CGI severity scale scores included zero and remained within 0.35 points or less (observed margins), suggesting that ziprasidone was as effective as olanzapine in improving the CGI severity scale scores. The last-observation-carried-forward, by-visit analysis indicated that both treatments rapidly improved CGI severity scale score, with no significant difference between the groups except at day 7, when the ziprasidone group demonstrated a greater improvement than the olanzapine group (p<0.007, ANCOVA). Similar results were obtained for completers.
Positive and Negative Syndrome Scale total score
Baseline Positive and Negative Syndrome Scale scores (total, positive symptom, and negative symptom scores) were also similar for the two treatment groups, and both treatments improved all three scores over the course of the 6-week study. There were no significant differences between treatments. The 95% confidence intervals for differences in least squares mean change (ziprasidone minus olanzapine) in the total score (95% CI=–5.63 to 3.35 for the last inpatient visit; 95% CI=–4.44 to 5.21 at endpoint), which included zero and remained within 6 points or less (observed margins), indicated that ziprasidone was as efficacious as olanzapine in improving this measure.
The last-observation-carried-forward, by-visit analysis indicated that both ziprasidone and olanzapine treatment resulted in rapid improvement in total, positive symptom, and negative symptom scores. No significant differences between the groups were observed except at the week 1 visit, when differences in favor of ziprasidone in the total score (p<0.03, ANCOVA) and the positive symptom score (p<0.03, ANCOVA) were found.
BPRS core items score and anxiety and depression score
Ziprasidone and olanzapine both improved BPRS-derived core and anxiety-depression factors. There was no statistically significant difference between the ziprasidone and olanzapine groups at any visit or at endpoint.
CGI improvement scale
In CGI improvement scale ratings for the last inpatient visit, 41.3% of the patients in the ziprasidone treatment group were rated much improved and 11.1% were rated very much improved. At endpoint, 34.1% of the patients in the ziprasidone group were rated much improved and 15.1% were rated very much improved. In the olanzapine group, at the last inpatient visit, 43.4% of the patients were rated much improved and 10.1% were rated very much improved. At endpoint, 38.8% of the olanzapine-treated patients were rated much improved and 17.8% were rated very much improved. There were no significant differences between the ziprasidone and olanzapine groups at any study visit or endpoint in CGI improvement scale ratings.
Calgary Depression Scale for Schizophrenia
Improvements in depressive symptoms were demonstrated by the Calgary Depression Scale for Schizophrenia scores for both treatment groups, with no significant between-group difference (differences in least squares mean change [ziprasidone minus olanzapine]: p=0.78, 95% CI=–1.17 to 0.88 for the last inpatient visit; p=0.38, 95% CI=–0.48 to 1.24 for endpoint). Patients randomly assigned to receive ziprasidone improved from their baseline score of 6.0 by –2.39, and those treated with olanzapine had an average score of 5.7 at baseline that declined by –2.78 at endpoint. The 95% confidence intervals included zero and remained within 1.5 points or less, suggesting that ziprasidone was as efficacious as olanzapine in improving the Calgary Depression Scale for Schizophrenia score.
Safety, Tolerability, and Health Status
Adverse events
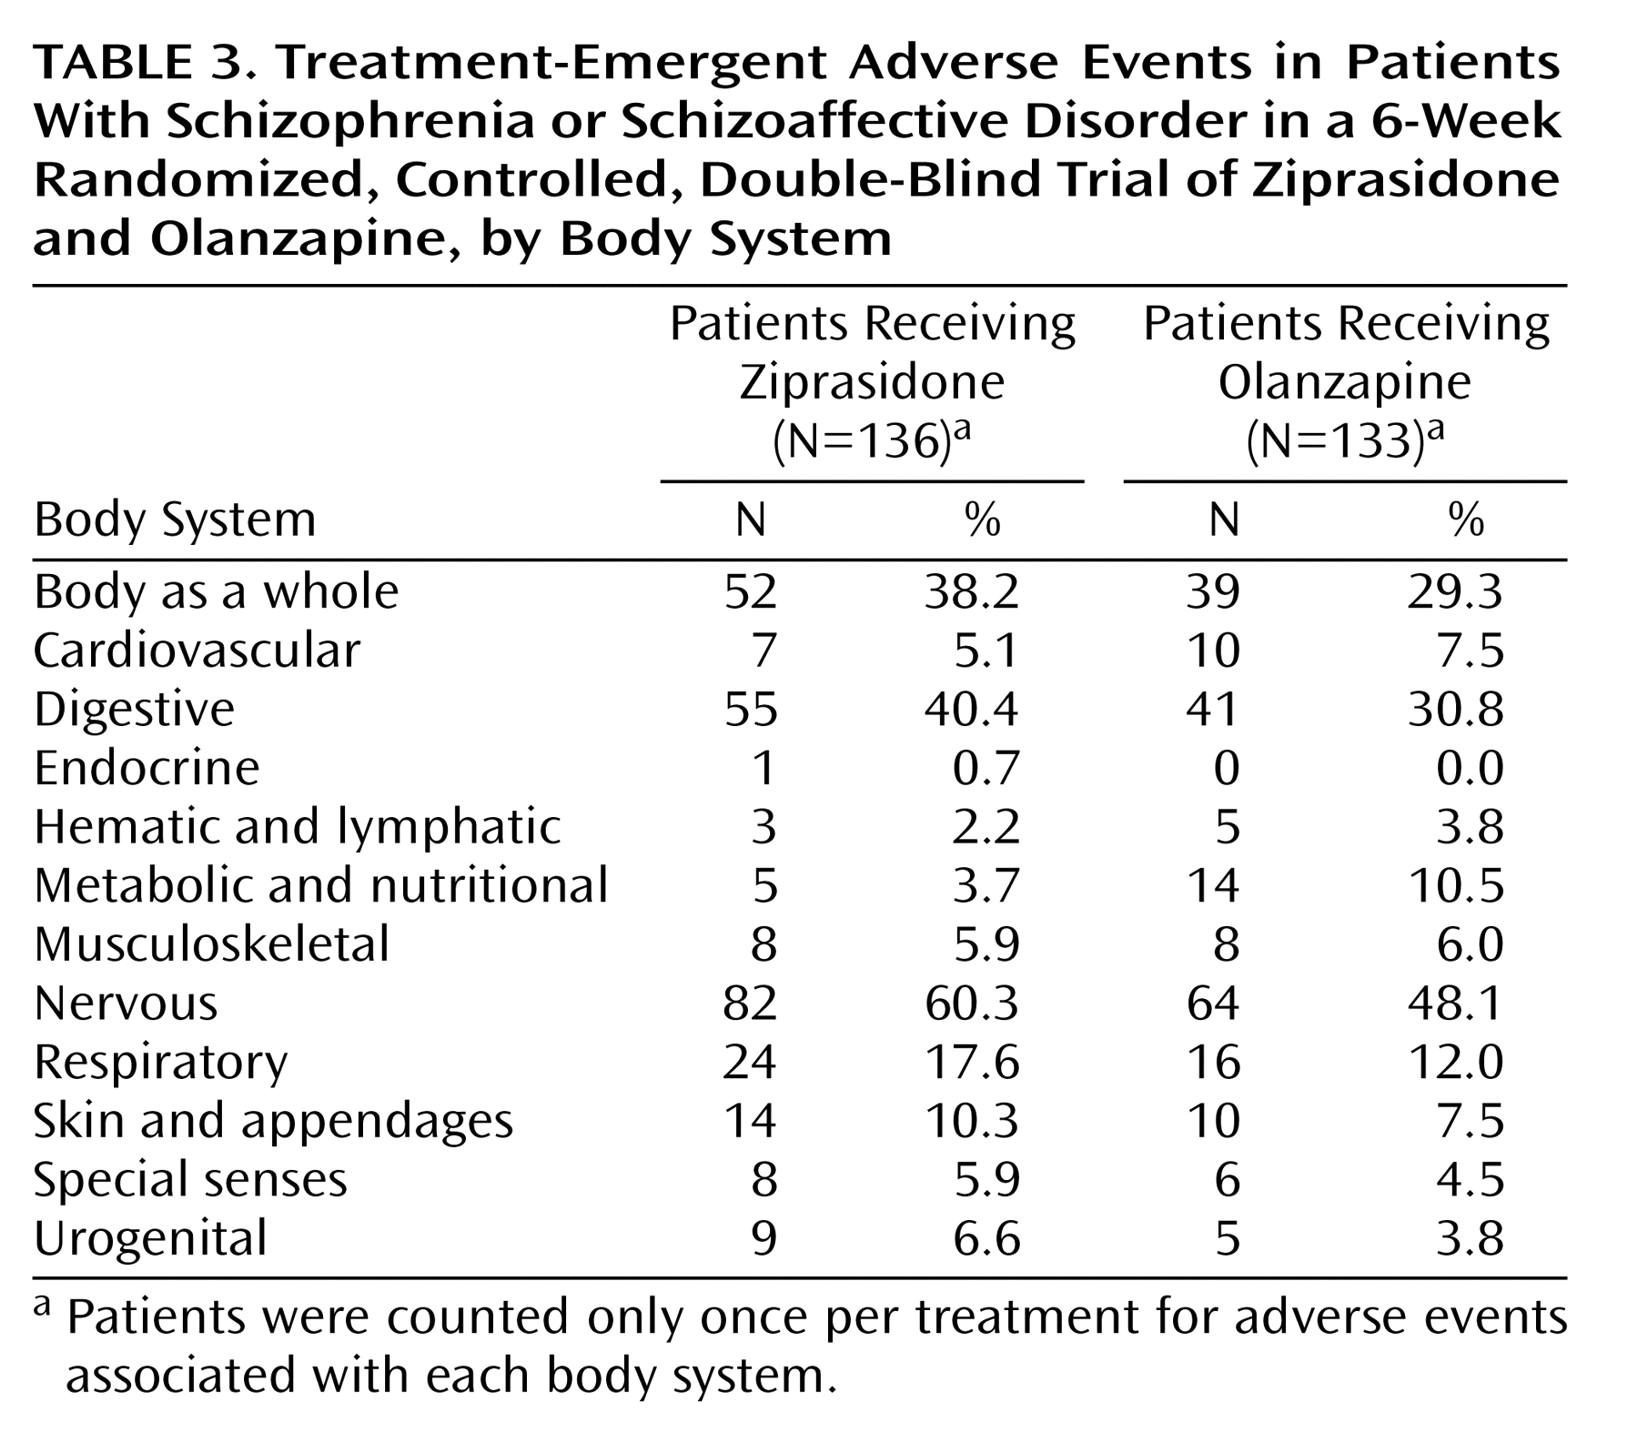
Treatment-emergent adverse events were experienced by 84.6% (115 of 136) of ziprasidone-treated patients and 71.4% (95 of 133) of olanzapine-treated patients (
Table 3); 46.3% (63 of 136) of ziprasidone-treated patients and 39.8% (53 of 133) of olanzapine-treated patients experienced treatment-emergent adverse events that were judged by investigators to be treatment related.
Movement disorder evaluation
At baseline, Extrapyramidal Symptoms Rating Scale, Barnes akathisia scale, and AIMS scores were similar for the two groups. There were no significant differences between treatment groups at endpoint for any of these measures, and the scores for these measures were low in both groups. The mean score for the Extrapyramidal Symptoms Rating Scale parkinsonian, dystonia, and dyskinesia behavioral item decreased from 2.2 at baseline to 1.8 at endpoint in patients receiving ziprasidone and from 1.8 to 1.4 in those receiving olanzapine (p=0.49, t test derived from ANCOVA). The Barnes akathisia scale mean score remained unchanged at 2.0 in patients receiving ziprasidone, and decreased from 1.6 to 1.4 in those randomly assigned to receive olanzapine, but the between-group difference was not significant (p=0.11, t test derived from ANCOVA). The mean AIMS movement ratings total score decreased from 1.7 to 1.3 in patients receiving ziprasidone and from 1.8 to 1.4 in those randomly assigned to receive olanzapine (p=0.94, t test derived from ANCOVA).
Body weight, body mass index, and vital signs
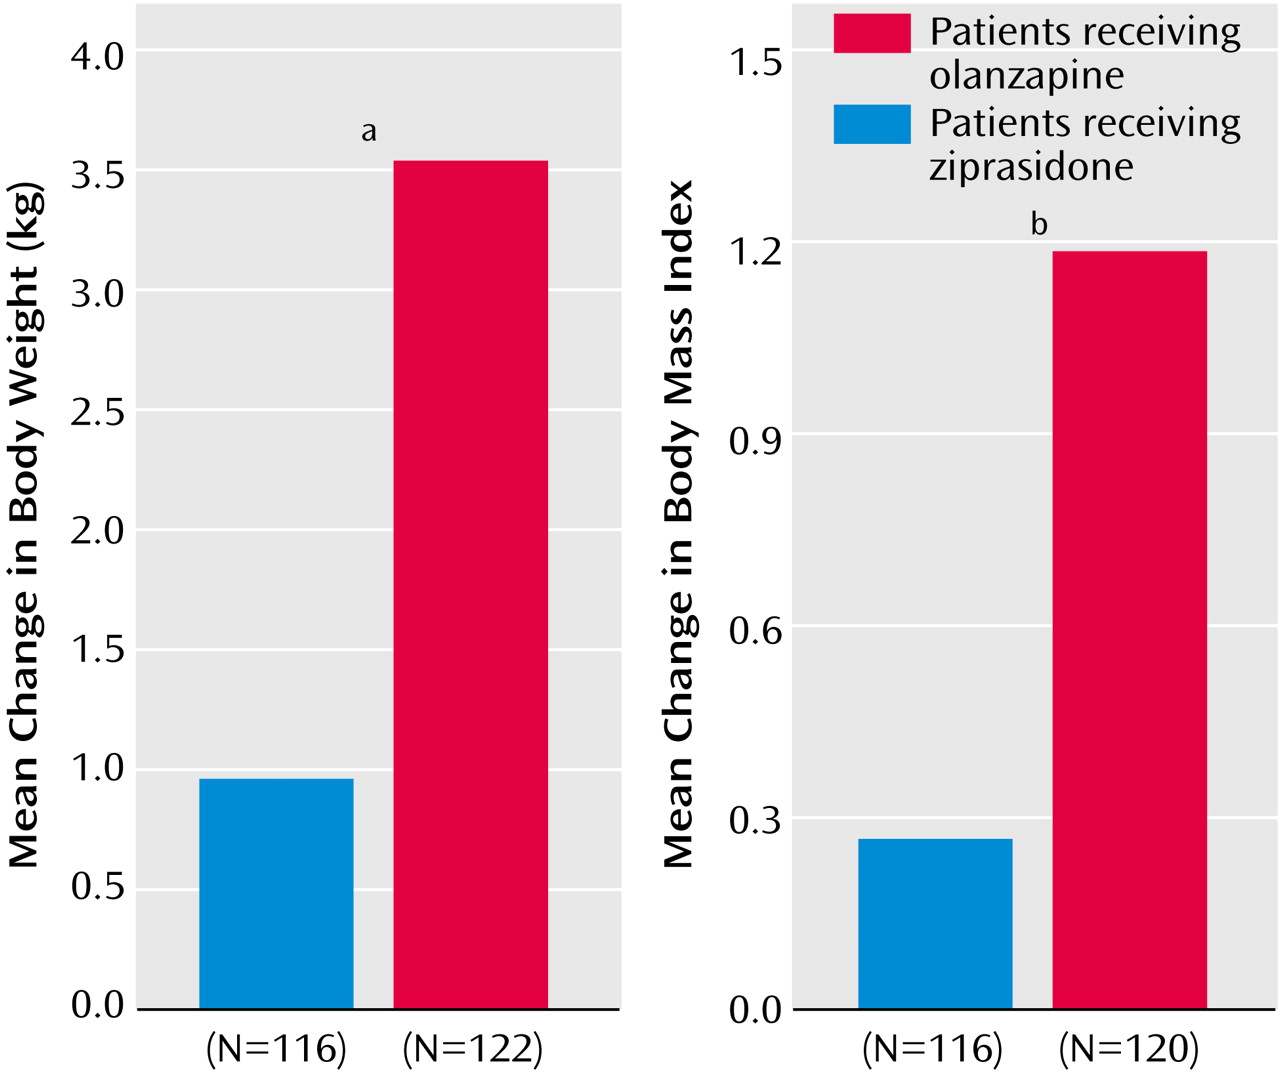
Among patients for whom baseline and endpoint weight and height data were available (116 patients in the ziprasidone group and 120 patients in the olanzapine group), the baseline mean body weight values and baseline body mass index values for the two groups were comparable. Compared with the ziprasidone-treated patients, the olanzapine-treated patients exhibited significantly greater changes in weight (p<0.001, t test derived from ANCOVA) and body mass index (p=0.0005, t test derived from ANCOVA) (
Figure 3). There were few clinically significant changes in vital signs associated with either treatment.
Clinical Laboratory Test Values
Standard clinical laboratory tests
Sixty-six (58%) of 113 patients in the ziprasidone group and 80 (67%) of 119 patients in the olanzapine group had clinically significant laboratory test abnormalities when laboratory test results were analyzed without regard to baseline abnormality. The median values for most laboratory parameters in the two treatment groups were comparable, and only small, clinically insignificant changes from baseline were noted during the course of the study.
Serum lipid profile
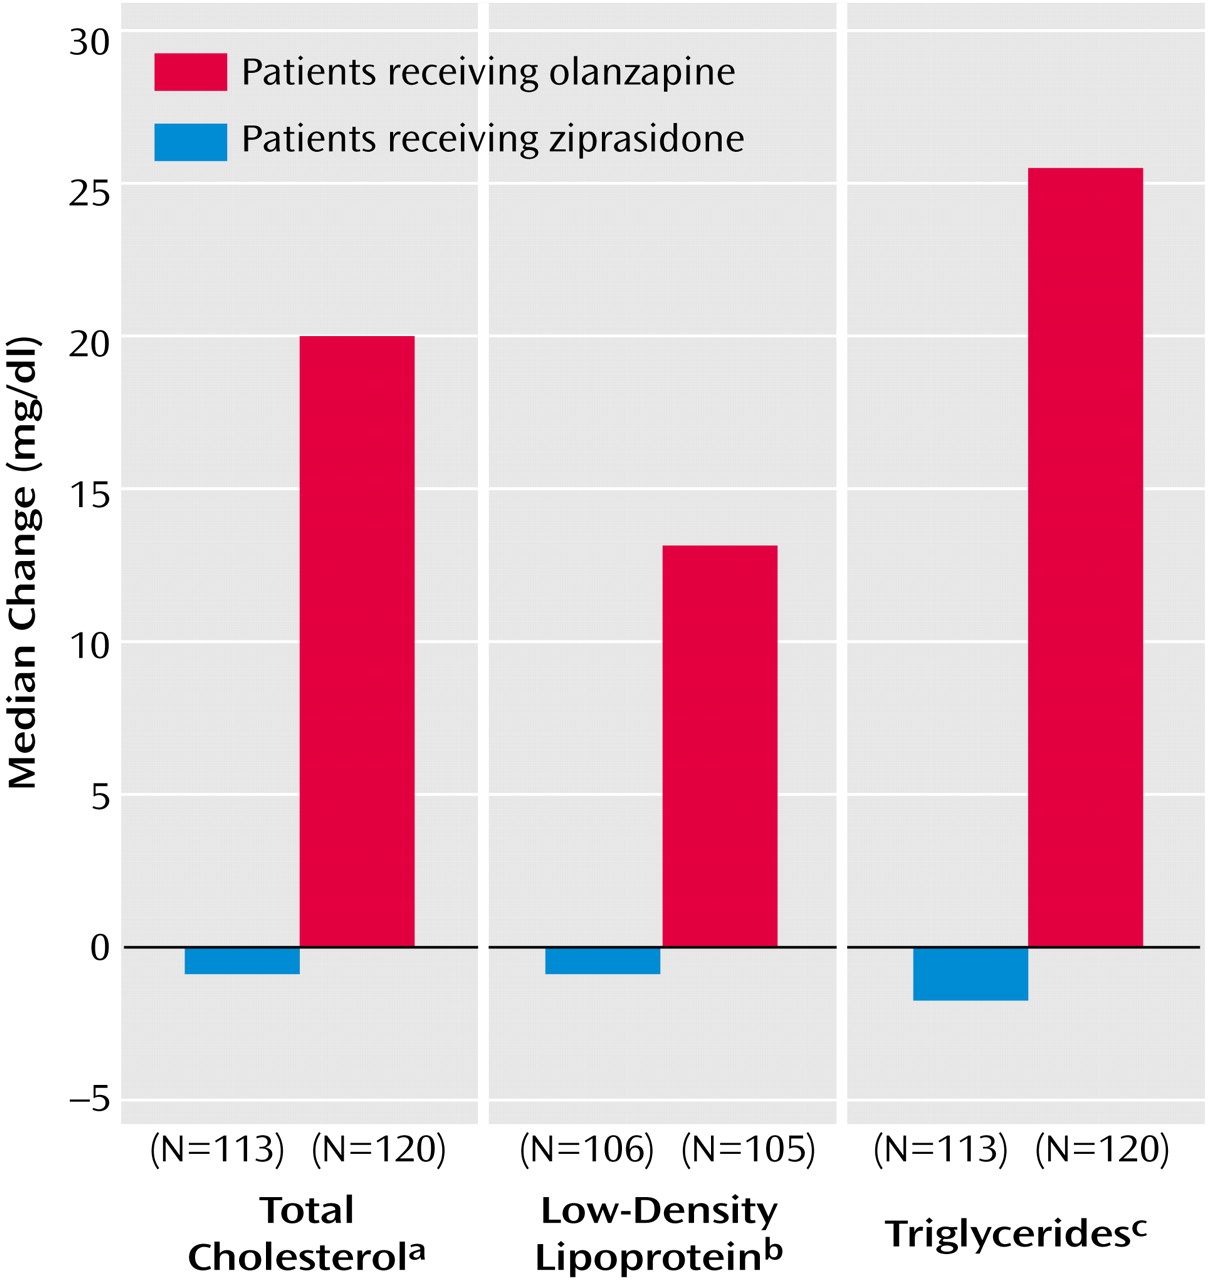
Changes from baseline to endpoint (week 6 or early termination) in fasting total cholesterol, LDL cholesterol, and triglycerides are shown in
Figure 4. In patients who received olanzapine, there was a median increase of 19.5 mg/dl in total cholesterol, compared with the baseline median of 183.5 mg/dl (p<0.0001, Wilcoxon matched-pairs signed ranks test). Patients who received ziprasidone had a median change of –1 mg/dl, compared with the baseline median of 185.0 mg/dl (p=0.48, Wilcoxon matched-pairs signed ranks test). The difference between groups in median change in total cholestorol was significant (p<0.0001, rank ANCOVA with adjustment for baseline values). The level of triglycerides increased by a median of 26 mg/dl from a baseline median of 124 mg/dl in the olanzapine group (p=0.0003, Wilcoxon matched-pairs signed ranks test) and decreased by a median of 2 mg/dl from a baseline median of 123 mg/dl in the ziprasidone group (p=0.77, Wilcoxon matched-pairs signed ranks test). The difference between groups in median change in the level of triglycerides was significant (p<0.003, rank ANCOVA with adjustment for baseline values). The LDL cholesterol level increased by a median of 13 mg/dl from a baseline median of 108 mg/dl in the olanzapine group (p<0.0001, Wilcoxon matched-pairs signed ranks test) and decreased by a median of 1 mg/dl from a baseline median of 114 mg/dl in the ziprasidone group (p=0.78, Wilcoxon matched-pairs signed ranks test); the difference between groups in change in median values was significant (p<0.0004, rank ANCOVA with adjustment for baseline values). The homocysteine level decreased by a median of 1.06 mg/dl from a baseline median of 9.32 mg/dl in the olanzapine group (p<0.0001, Wilcoxon matched-pairs signed ranks test) and by a median of 0.38 mg/dl from a baseline median of 8.57 mg/dl in the ziprasidone group (p<0.002, Wilcoxon matched-pairs signed ranks test); the difference between groups in change in median values was significant (p<0.005, rank ANCOVA with adjustment for baseline values). The apolipoprotein B level increased by a median of 9.0 mg/dl from a baseline median of 91.0 mg/dl with olanzapine (p<0.0001, Wilcoxon matched-pairs signed ranks test) and decreased by a median of 3.0 mg/dl from a baseline median of 97.5 mg/dl with ziprasidone (p=0.17, Wilcoxon matched-pairs signed ranks test); the difference between groups in change in median values was significant (p<0.0001, rank ANCOVA with adjustment for baseline values). Neither treatment was observed to significantly alter HDL cholesterol, apolipoprotein A-I, or lipoprotein (a) levels.
Glucose metabolism
Neither treatment was observed to affect significantly fasting serum glucose levels. For patients who received ziprasidone, the median baseline glucose level was 92.0 mg/dl and the median change from baseline was 1.0 mg/dl. For patients who received olanzapine, the median baseline glucose level was 90.5 mg/dl and the median change from baseline was 1.0 mg/dl. However, measurements of glucose metabolism demonstrated significant effects of olanzapine, but not ziprasidone, on serum insulin, C-peptide, and HOMA-IR (log). In patients who received olanzapine, the fasting serum insulin level increased by a median of 3.30 μU/ml from a baseline median of 9.90 μU/ml (p<0.0001, Wilcoxon matched-pairs signed ranks test), compared with a median increase of 0.25 μU/ml from a baseline median of 11.75 μU/ml (p=0.33, Wilcoxon matched-pairs signed ranks test) in patients who received ziprasidone. The difference between groups in change from baseline approached significance (p=0.051, rank ANCOVA with adjustment for baseline values). The level of C-peptide in patients who received olanzapine increased by a median of 0.46 μU/ml from a baseline median of 2.65 μU/ml (p<0.0001, Wilcoxon matched-pairs signed ranks test), compared with a median increase of 0.16 μU/ml from a baseline median of 2.85 μU/ml (p=0.29, Wilcoxon matched-pairs signed ranks test) in patients who received ziprasidone. The difference between groups in change from baseline did not reach significance (p=0.07, rank ANCOVA with adjustment for baseline values). Olanzapine-treated patients exhibited a median increase in HOMA-IR (log) of 0.26 from a baseline median of 3.66 (p<0.0001, Wilcoxon matched-pairs signed ranks test), compared with a median increase of 0.06 from a baseline median of 3.87 (p=0.22, Wilcoxon matched-pairs signed ranks test) in patients who received ziprasidone. The differences between groups in change from baseline did not reach significance (p=0.08, rank ANCOVA with adjustment for baseline values).
Uric acid
Both treatments were associated with increased uric acid levels, but the increase observed for olanzapine was significantly greater than that with ziprasidone. Uric acid increased from a baseline median of 5.50 mg/dl by a median of 0.65 mg/dl in patients who received olanzapine, compared with a median increase of 0.10 mg/dl from a baseline median of 5.40 mg/dl for the ziprasidone group (p<0.0001 and p<0.03, respectively, for within-group comparisons of change from baseline, Wilcoxon matched-pairs signed ranks test; p<0.004 for between-group comparison of change from baseline, rank ANCOVA).
QTc Interval
The mean change from baseline for QTc interval was 6.08 msec in the ziprasidone group and 0.52 msec for the olanzapine group (p<0.05, t test, two-tailed), consistent with the known profile of each compound. No patient in either group exhibited a QTc interval ≥500 msec.
Discussion
To our knowledge, this study is the first published randomized, double-blind comparison of ziprasidone and olanzapine. Our results demonstrate that ziprasidone was comparable in efficacy to olanzapine in improving all measures of psychosis, depressive symptoms, and disease severity and that both agents were well tolerated overall.
A unique aspect of this trial was the thorough evaluation of changes in metabolic parameters as well as weight. Ziprasidone had minimal effects on weight and was not associated with adverse changes in blood lipids or measures of glycemic control. In contrast, olanzapine was associated with significant increases in body weight, fasting lipids, fasting insulin, and HOMA-IR (log), a well-established measure of insulin resistance.
We observed a mean weight increase of 3.57 kg in patients who received olanzapine. The finding of weight gain with olanzapine is consistent with results of a meta-analysis
(2). In the general population, obesity is a risk factor for death from coronary heart disease
(46), and larger epidemiological studies support the plausibility of a linear relationship between increase in body weight above normal and mortality
(47). Obesity is also associated with hypertension, type II diabetes, and certain malignancies (e.g., prostate, ovarian, and colon cancers)
(46).
In our study, olanzapine-treated patients had median changes in total cholesterol, LDL cholesterol, and triglyceride levels that represented increases from baseline of approximately 10%, 13%, and 25%, respectively. Elevated LDL cholesterol is a major risk factor for coronary heart disease and other clinical sequelae of atherosclerosis, and the relationship between LDL cholesterol and coronary heart disease risk is continuous throughout the range of values typically found in the United States
(48). Risk of coronary heart disease rises with increased cholesterol level, but especially when the total cholesterol level rises above 200 mg/dl
(49). Elevation in triglycerides is also a risk factor for coronary heart disease
(50); in a meta analysis, a 1-mmol/liter (88.7-mg/dl) increase in the level of triglycerides was associated with a 32% increase in risk of coronary heart disease in men and a 76% increased risk in women
(51). Olanzapine has been associated with significant hypertriglyceridemia in other studies
(28,
29).
In this study, the median change in insulin levels observed in olanzapine-treated patients represented a 33.7% increase over median baseline, in contrast to a 2.9% increase in ziprasidone-treated patients. The median HOMA-IR (log) change associated with olanzapine represented a 7.4% increase, compared with a 1.8% increase associated with ziprasidone. In individuals without diabetes, increased insulin concentrations generally reflect insulin resistance
(52). Hyperinsulinemia and insulin resistance strongly predict the development of type II diabetes, both in low-risk and high-risk populations
(53). Moreover, they have been associated in some studies with development of coronary heart disease.
An important consideration is whether the observed differences in changes in weight and metabolic parameters are sustained or increased in long-term treatment. Available data suggest that sustained or increased changes are likely. In a 1-year placebo-controlled trial, ziprasidone demonstrated a weight-neutral profile
(6). Substantial increases in weight and triglycerides are sustained in long-term treatment with olanzapine
(28,
29,
54).
Schizophrenia is associated with higher liability for obesity and hyperglycemia or diabetes, independent of treatment
(2,
55). It is yet unclear whether schizophrenia or antipsychotic therapy for the disease is associated with increased risk of this syndrome. Risk of death related to coronary heart disease is significantly higher in persons with schizophrenia than in the general population, and the excess mortality seen in schizophrenia is due primarily to natural causes, e.g., coronary heart disease and cerebrovascular disease, rather than to suicide or other unnatural causes
(56). For patients with schizophrenia, increased risk of coronary events may be compounded by inadequate access to nonpsychiatric health care and by poor adherence to nonpsychiatric treatment
(57). Thus, possible adverse effects of medication on risk of cardiovascular disease may be of particular concern in many patients with schizophrenia.
In this study, a mean change from baseline in the QTc interval of 6.08 msec was observed in the ziprasidone group, compared with 0.52 msec for the patients who received olanzapine, a statistically significant difference. No patient had a QTc interval ≥500 msec while taking a study drug. These observations are consistent with the 6–10-msec change demonstrated with ziprasidone doses of 80–200 mg/day studied in fixed-dose, placebo-controlled trials
(58) and were not associated with any excess of cardiovascular adverse events.
In this trial, olanzapine was administered at a fixed dose of 5 mg/day on days 1 and 2 and 10 mg/day on days 3–7. For the remainder of the 6-week study, it was administered at a flexible dose of 5, 10, or 15 mg/day. This regimen is consistent with the current prescribing information for olanzapine, which recommends beginning with either 5 or 10 mg/day with a target dose of 10 mg/day within several days (package insert for Xyprexa [olanzapine], Eli Lilly and Company, Indianapolis, 2001). Accumulated clinical experience with an antipsychotic may indicate that the dose recommended in the labeling is not necessarily optimal. However, our regimen is also comparable to the flexible dosing regimen employed in the trial of olanzapine and risperidone reported by Conley and Mahmoud
(20), which began with 10 mg/day of olanzapine on days 1–2, followed by 5–10 mg/day on days 3–7, 5–15 mg/day on days 8–14, and 5–20 mg/day on days 15–56. In this 8-week study, the mean modal daily dose was 12.4 mg for olanzapine, compared with 11 mg in our study. It is noteworthy that the endpoint mean dose in the 8-week trial (13.1 mg/day) was nearly identical to the mean dose after week 5 in our study (13 mg/day).
Conclusions
In this study, ziprasidone demonstrated efficacy equivalent to olanzapine in controlling symptoms of schizophrenia, while being associated with a lower incidence of weight gain and more favorable effects on lipid profile and other metabolic parameters. Additional controlled studies are needed to evaluate the efficacy and tolerability of ziprasidone versus olanzapine in longer-term treatment and to determine whether the differences between these agents with regard to weight gain and lipid and insulin alterations are sustained and are likely to influence general health status.
