Schizophrenia is characterized by abnormalities in brain function, including subtle neurological signs. Susceptibility to schizophrenia is mediated predominantly by genetic factors. Nevertheless, large-scale linkage studies have been largely unsuccessful in finding susceptibility genes. Dissecting schizophrenia into its component neurobiology and using biological traits as intermediate phenotypes can dramatically improve the power of genetic studies. For example, impairments in executive cognition and prefrontal cortical physiological efficiency have been shown to be associated with the met
108/158 val polymorphism in the
comt gene
(1), and sensory gating deficits may be attributable to mutations in a nicotinic receptor subunit
(2). Selecting informative intermediate phenotypes on the basis of brain dysfunction is thus of critical importance for improving the power of genetic studies of schizophrenia.
So-called neurological signs represent a potential intermediate phenotype because they suggest evidence of brain dysfunction and are not dependent on patients’ motivation or understanding instructions. Neurological signs have features characteristic of useful intermediate phenotypes. First, a higher frequency of neurological signs has consistently been found in studies of patients with schizophrenia
(3,
4). Second, these signs appear trait-like in that they are relatively stable over time
(5,
6) (although see reference
7), which is advantageous for genetic studies. Neurological signs are present from early in the illness
(8,
9). They do not appear to be secondary to neuroleptic medications
(10) (see reference
3) and can be reliably measured
(7,
11–
13) (although see reference
14). Finally, such signs may be present in only a subgroup of patients, consistent with the notion that schizophrenia is heterogeneous. Patients with neurological signs have poorer outcome, more negative symptoms, larger ventricles, and lower cortical volume than unaffected patients
(4,
8,
10,
12,
15,
16). On the other hand, several confounds could complicate the use of neurological signs, including the fact that different studies have used different scales and that phenocopies could arise because of perinatal complications
(17), head trauma, alcoholism
(12), or aging
(6). Furthermore, it is unclear whether lumping such disparate findings together has any meaning from genetic and/or neurobiological perspectives.
The notion that neurological signs have genetic origins arose from the observation that they are present in nonschizophrenic family members of patients with schizophrenia
(16,
18). It is difficult to reconcile this observation with an environmental cause because family members differ from the general population primarily in their risk for schizophrenia, which has no apparent shared familial, environmental component
(19). Studies of family members, however, have generally used small samples
(16,
20,
21) and have been skewed toward subjects with schizophrenia spectrum disorders
(20). Furthermore, heritability estimates are lacking. The utility of intermediate phenotypes depends in part on the portion of total phenotypic variance attributable to genetic causes and to genetic architecture. If a large portion of phenotypic variance is genetic, intermediate phenotypes may increase the power to find susceptibility loci.
A useful measure for indirectly assessing the strength of the genetic component is relative risk
(22,
23). This measure assesses the risk of having an abnormality (e.g., more neurological signs) for relatives compared with the risk for the general population. Although greater relative risk can be attributable to either shared environmental factors or genetic causes, relative risk sets an upper limit on heritability
(24). A relative risk that is moderate (risk of 2–4) or higher (risk greater than 4) suggests that a phenotype may be suitable for genetic analysis
(23,
25). Since path analytic studies suggest that there is no environmental component shared by siblings that increases the risk for schizophrenia
(19), biological abnormalities associated with greater risk for schizophrenia are likely to have predominantly genetic determinants accounting for that portion of phenotypic variance.
We studied a group of patients with schizophrenia, their siblings, and normal comparison subjects to test several hypotheses: 1) neurological signs are more common in siblings of patients with schizophrenia than in normal comparison subjects, 2) relative risk for neurological signs is increased in siblings of patients with schizophrenia, 3) constellations of neurological signs referable to specific brain regions are familial, and 4) neurological signs are not redundant with other intermediate phenotypes. To our knowledge, this is the first study to examine such a large, extensively screened family sample and to estimate relative risk. Parents were not studied because of the uncertain impact of aging on neurological signs
(26).
Method
One hundred fifteen index cases of patients with a diagnosis of schizophrenia, 185 of their full siblings, and 88 normal comparison subjects participated in a study of neurobiological phenotypes associated with schizophrenia (the Clinical Brain Disorders Branch/National Institute of Mental Health [NIMH] Sibling Study
[27]). Siblings were not selected on the basis of their psychiatric status. Procedures were approved by the NIMH Institutional Review Board. Details of subject recruitment and exclusion criteria have been described previously
(27). Briefly, families were recruited from local and national sources. The comparison group was recruited from the NIH volunteer office and was matched to the sibling group on age, gender, education, IQ, and Wide-Range Achievement Test (WRAT-R) performance
(28). All participants were prescreened to exclude those with premorbid IQ below 70, those with recent (within 1 year) drug or alcohol abuse or more than 5 years of previous abuse, and those with substantial medical or neurological conditions. The comparison subjects were selected with the additional requirement that they not have a first-degree relative with a schizophrenia spectrum disorder
(27). All patients were clinically stable. Written informed consent was obtained from all subjects after complete description of the study.
All subjects were interviewed by a research psychiatrist blind to family status (L.B.B.) who used the Structured Clinical Interview for DSM-IV Axis I Disorders Research Version
(29). A second research psychiatrist (M.F.E.) reviewed all diagnostic data, and the consensus diagnosis between the two researchers was used. All subjects had a thorough medical evaluation, including magnetic resonance imaging of the brain. Subjects were also tested on IQ, WRAT-R reading (a measure of premorbid intelligence), working memory/executive function (Wisconsin Card Sorting Test), psychomotor speed/oculomotor scanning (trials B), attention (Continuous Performance Test), and verbal memory (California Verbal List Test)
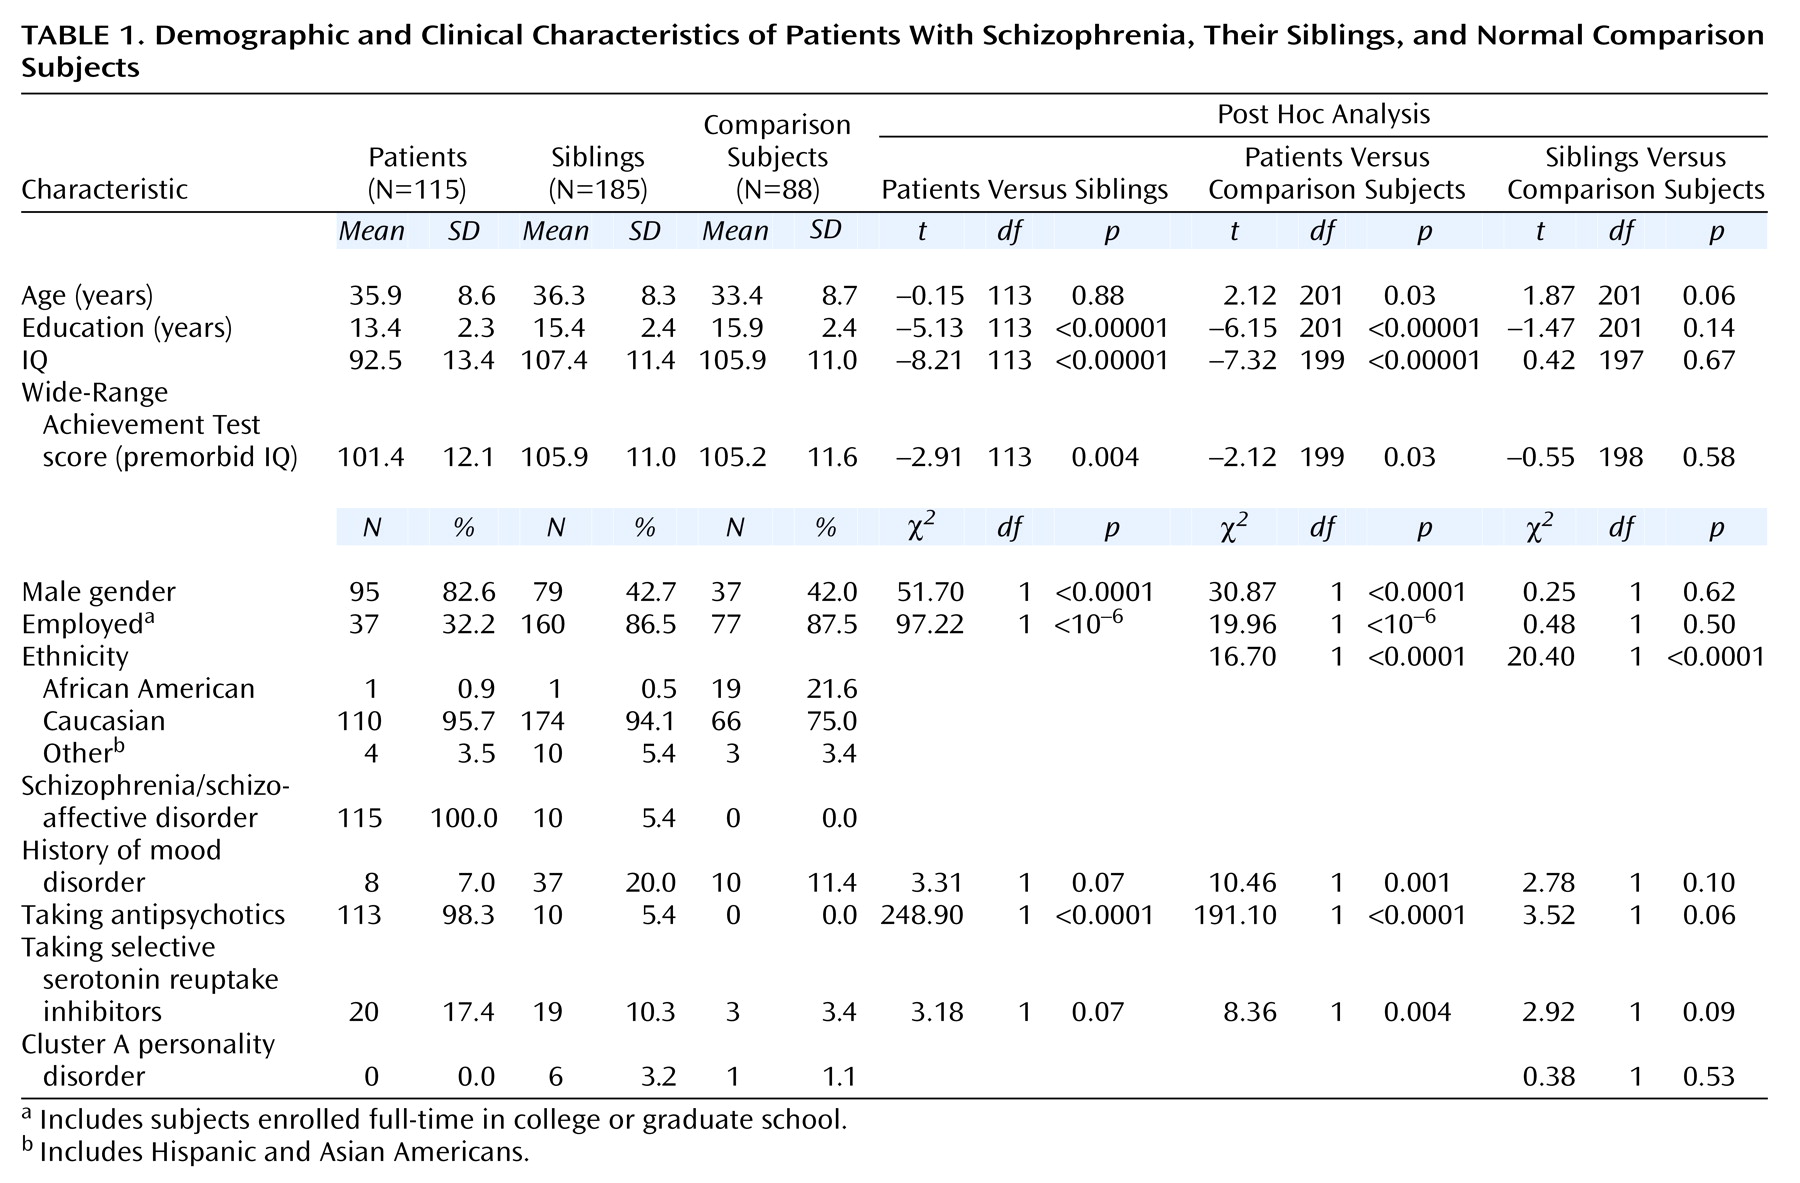
(30). Demographic data are presented in
Table 1.
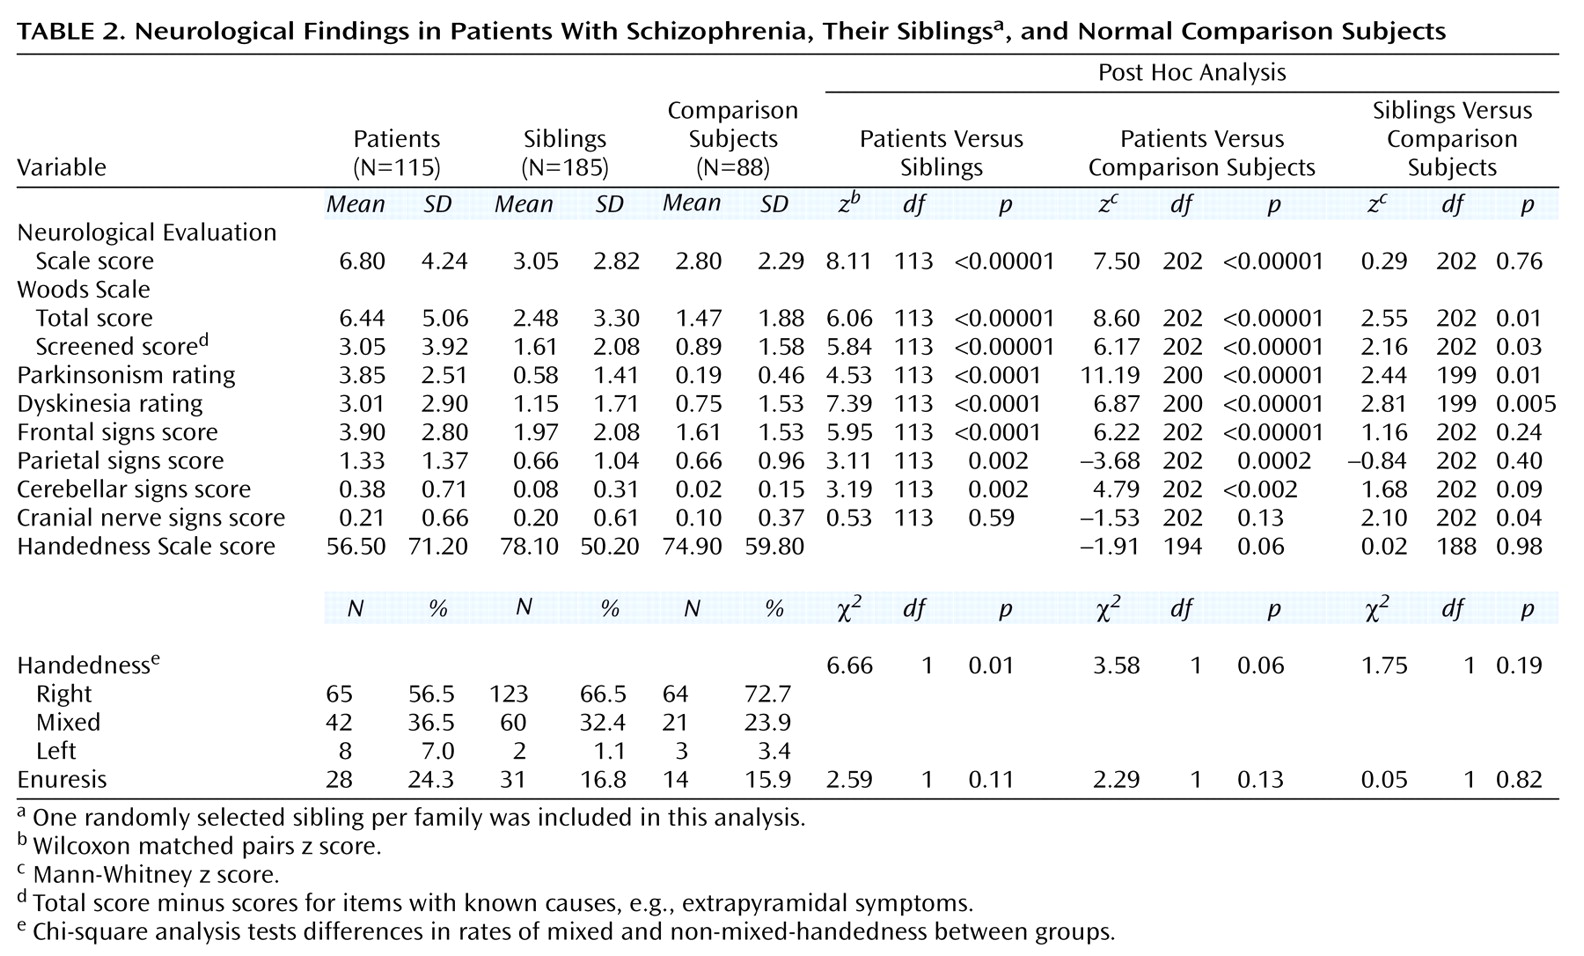
Subjects underwent a detailed neurological examination by one of two research neurologists who were formally blind to diagnosis and familial relationships (T.M.H. and V.S.M.). Interrater reliability was assessed on 10 patients. For all items listed in
Table 2, except for cerebellar and parietal scores, ratings were significantly correlated (intraclass correlation coefficient=0.54–0.90, p<0.02). The exceptions were due to the paucity of these signs in the 10 patients jointly examined; the results are included for comparison with previous studies.
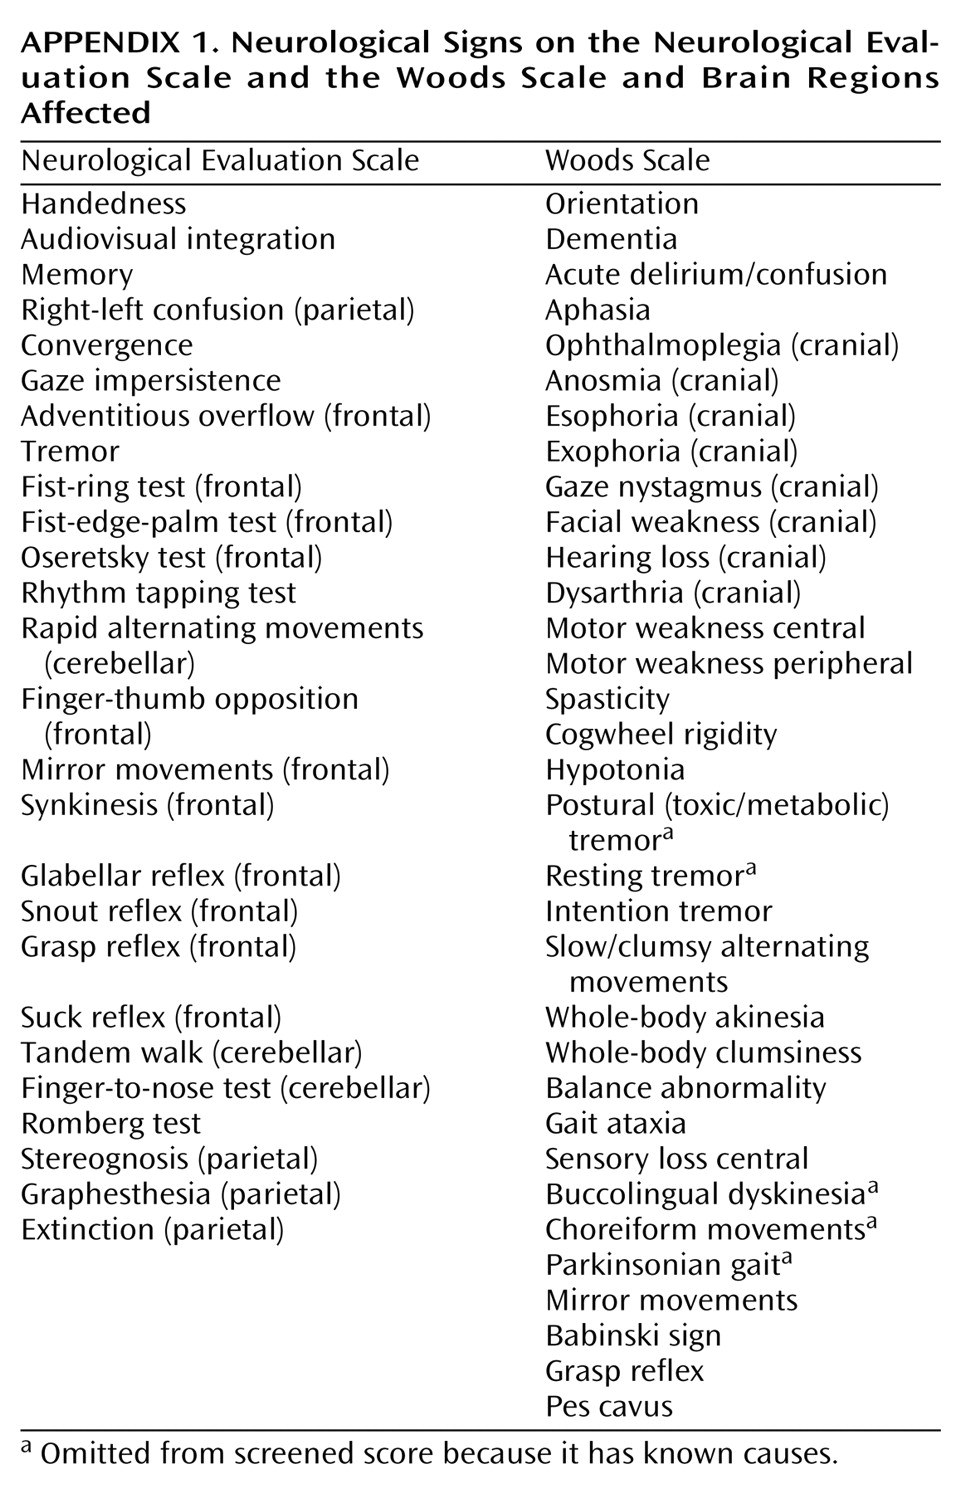
The examination included the Neurological Evaluation Scale
(31) and the Woods Scale
(32), scored as described elsewhere
(31,
32) (
Appendix 1). For the Woods Scale, we included the total score and a screened score, which omits items with known causes such as medication-induced extrapyramidal signs. For consistency, we omitted these items for all subjects for the screened scores. To address the issue of localizability, items from the Neurological Evaluation Scale and the Woods Scale were included in composite measures of findings thought to be attributable to different brain regions
(33,
34), as has been done in previous studies
(35,
36). These included frontal, temporal, parietal, occipital, cerebellar, and brainstem regions (
Appendix 1).
Additional measures related to neurodevelopment were gathered on the basis of previous findings of abnormalities in patients. Handedness
(37) was ascertained by using the Edinburgh Handedness Scale
(38). This generated scores from 100 to –100 (left=–100, right=100, –100<mixed<100) [
37,
39]). Ratings for extrapyramidal movements were assessed by using a modified Abnormal Involuntary Movement Scale that included parkinsonian signs
(40). History of enuresis, which may be more frequent in patients with schizophrenia
(41), was assessed by using DSM-IV criteria. The primary outcome measures were the Neurological Evaluation Scale score and the Woods Scale total and screened scores. For these measures, which are not independent, p=0.05 was accepted as significant. Other outcome measures were secondary, and a p value of 0.01 was accepted as significant.
Data analyses were performed by using Statistica (Statsoft Corp, Tulsa, Okla.). Differences between groups were tested by using paired and unpaired t tests for continuous measures or Wilcoxon matched pairs, Mann-Whitney U test, or chi-square analysis as indicated. To avoid inflating the degrees of freedom, only one randomly selected sibling per family was used for group comparisons.
Relative risk of neurological signs was estimated as described previously
(27). Briefly, subjects were classified as having neurological signs if their score was above the cutoff values of one, two, and three standard deviations above the comparison group mean. All siblings were used to estimate relative risk values
(42). Additionally, high-risk subsets of siblings, which included only those who were siblings of patients with elevated scores on a specific test, were used to estimate a second relative risk score. These high-risk groups were examined separately to address more directly the hypothesis that clusters of neurological findings are familial in subgroups of patients who themselves have a specific neurological abnormality. This is similar, for example, to looking at the risk of hypercholesterolemia only in relatives of patients with ischemic heart disease who themselves have hypercholesterolemia.
Results
Demographic variables of all of the subjects are presented in
Table 1. The sibling group was well matched to the comparison group on most measures. More of the comparison subjects than the siblings were of African American descent. Because of this, we examined effects of ethnicity within the comparison group for all measures. When we found a significant effect, we conducted two additional analyses that 1) covaried for ethnicity and 2) included only subjects of Caucasian descent (the largest ethnic group in the study). Because marginally more siblings than comparison subjects took selective serotonin reuptake inhibitors (SSRIs), we examined the effects of SSRIs on all measures when siblings differed from comparison subjects.
Patients with schizophrenia had higher scores on both scales than siblings and comparison subjects (
Table 2). Siblings did not differ from comparison subjects on the Neurological Evaluation Scale, although a significant effect of ethnicity was seen (Mann-Whitney z=–2.22, N=88, p=0.03), as previously reported
(31). No difference was observed on the Neurological Evaluation Scale between Caucasian siblings and comparison subjects (Mann-Whitney z=1.05, N=243, p=0.30) or when ethnicity was used as a covariate (F=1.71, df=1, 176, p=0.19). Siblings had higher scores than comparison subjects on the total and screened scores on the Woods Scale. There was no effect of ethnicity on either measure. SSRI use was not related to higher total score (Mann-Whitney z=–1.86, N=185, p=0.07) or screened score (Mann-Whitney z=–0.18, N=185, p=0.85) on the Woods Scale. Using ethnicity as a covariate did not affect either analysis. To test whether differences were attributable primarily to siblings with schizophrenia spectrum disorders, we compared only siblings without such diagnoses with normal subjects. Their total (Mann-Whitney z=1.83, N=193, p=0.07) and screened (Mann-Whitney z=1.55, N=193, p=0.12) scores on the Woods Scale were marginally elevated.
The higher rate of neurological signs in the siblings came in part from items referable to the prefrontal cortex and cranial nerves; however, their scores for these constellations were not elevated (
Table 2). There was no effect of ethnicity or of SSRI use for these measures. The most common abnormalities rated in both groups included spasticity, dyskinetic movements, parkinsonian symptoms, mirror movements, grasp reflex, and pes cavus. Extrapyramidal ratings can be affected by psychotropic medications (neuroleptics and SSRIs). In siblings, SSRI use was associated with higher parkinsonian ratings (Mann-Whitney z=–3.35, N=185, p=0.03) but only marginally with dyskinesia ratings (Mann-Whitney z=–1.79, N=185, p=0.07). Excluding subjects who were taking neuroleptics or SSRIs, we found that the significance levels were reduced (Mann-Whitney z=1.27, N=177, p=0.20, for parkinsonian ratings and z=1.82, N=177, p=0.06, for dyskinesia ratings). Patients had the same incidence of both left-handedness and right-handedness as comparison subjects (
Table 2). Siblings did not differ from comparison subjects on handedness. No differences were seen between groups for history of enuresis.
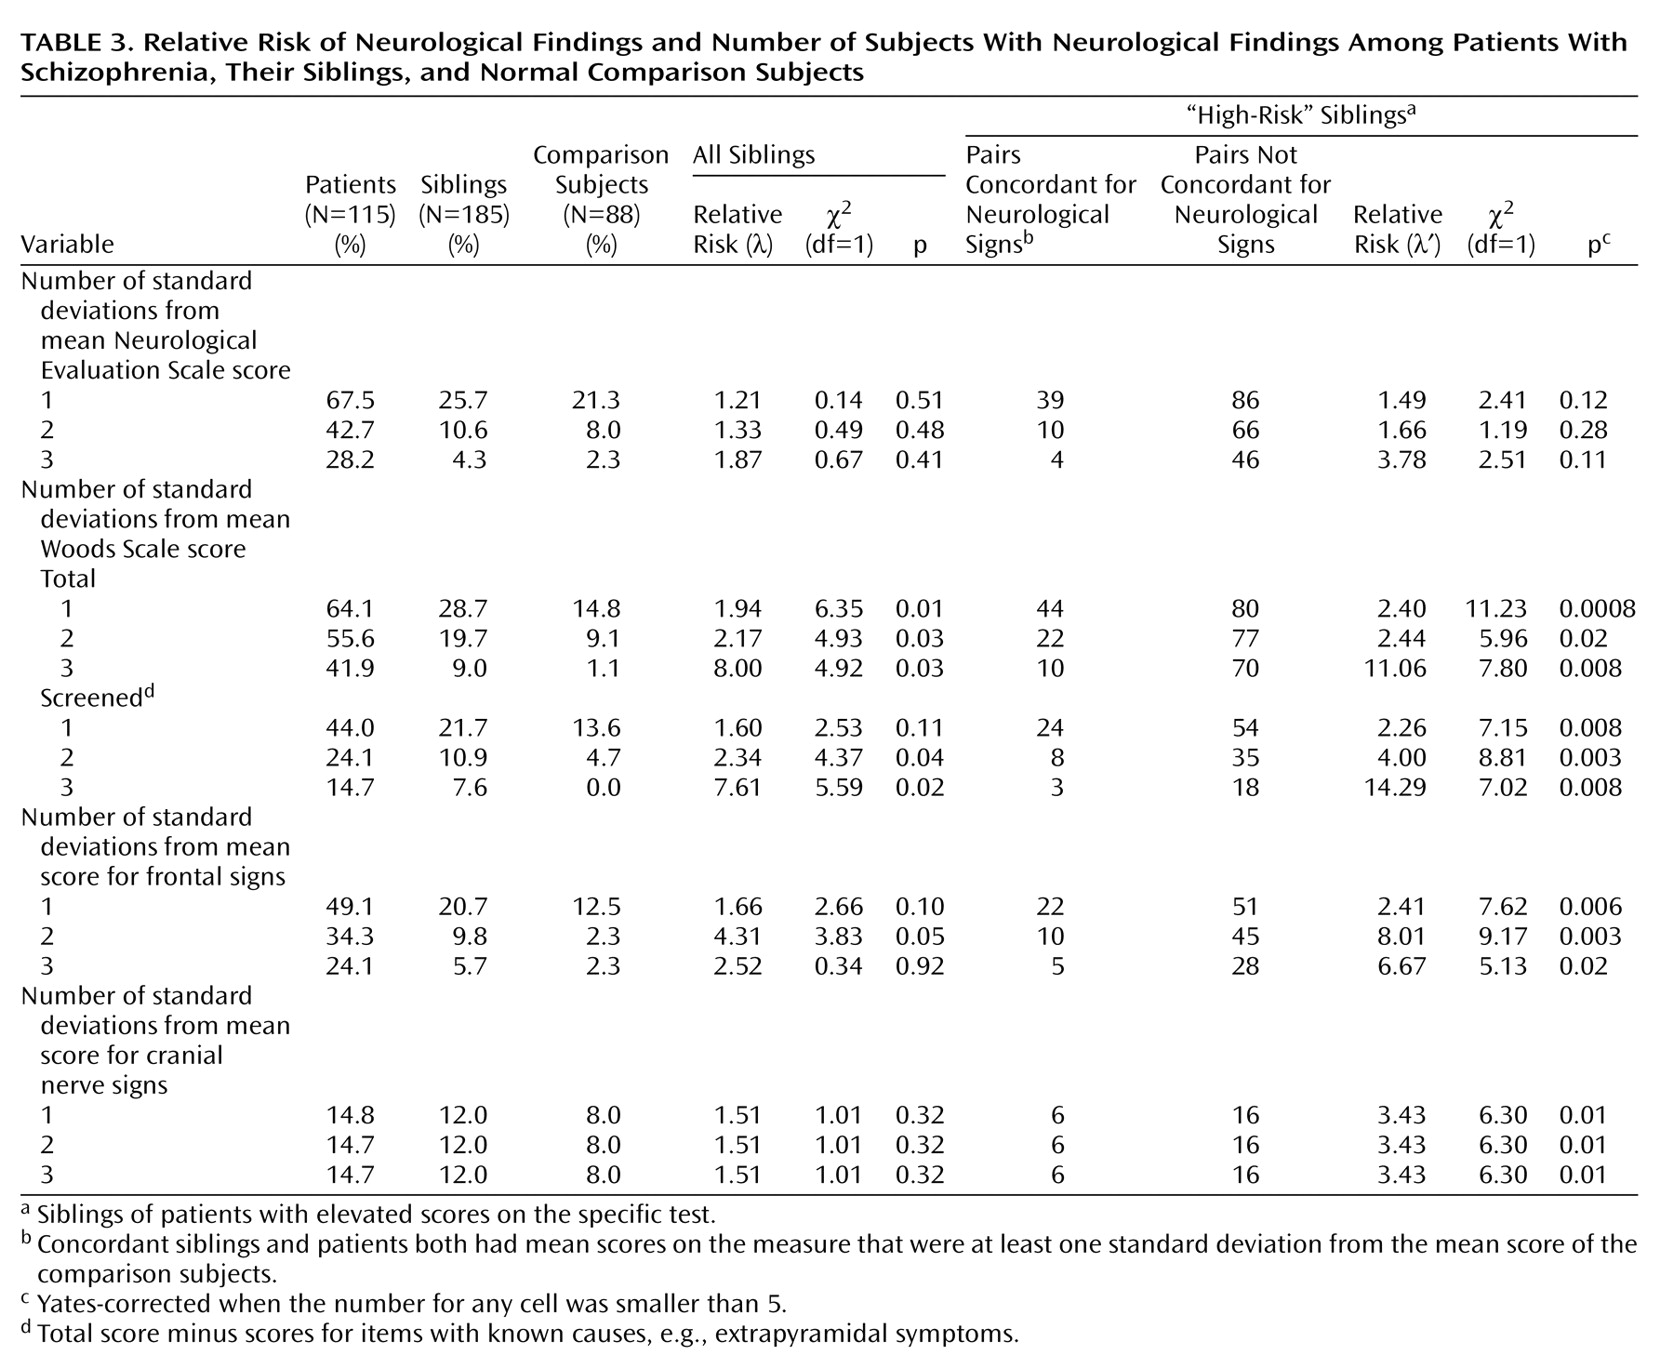
Using Woods Scale scores, we found that relative risk (λ) of neurological signs was elevated in siblings when one standard deviation above the comparison mean was used as the criterion for defining which subjects had neurological signs (
Table 3). To explore whether the significantly higher relative risk for the Woods Scale was partly attributable to medication effects in siblings, we repeated the analysis excluding subjects who were taking psychotropic medications. The relative risk was somewhat lower (λ=1.62), and the statistical significance was reduced (χ
2=3.00, df=1, p=0.08). Using Woods Scale screened scores, which omit items that could possibly be due to medications (even in subjects not taking medication), we found that the relative risk was slightly elevated when two and three standard deviations were used to define affected siblings. High-risk siblings of patients positive for neurological findings had a significantly increased risk for neurological findings when we used the Woods Scale screened scores as well as frontal and cranial nerve sign scores (right-hand columns in
Table 3). Despite the moderate to high relative risk values, the total number of siblings with neurological signs was small relative to the total number of siblings studied. This low yield is unfavorable for genetic studies.
Correlations between neurological findings and cognitive measures for siblings are listed in
Table 4. For this analysis, we included only siblings with no DSM-III psychiatric disorder. The relative risk of these cognitive measures was higher in siblings than in the comparison subjects, and these measures have been used in genetic studies of schizophrenia
(1,
30). The correlations are generally somewhat low, suggesting that they assess independent processes. Using multiple regression, for example, we found that the four cognitive measures combined accounted for 1% of the variance for the Woods Scale total scores (F=0.30, df=4, 105, p=0.06) in the group of healthy siblings and less than 3% of the variance in whether a sibling was described as having neurological signs (i.e., the siblings’ mean total score on the Woods Scale was one standard deviation above the mean total score of the comparison group).
Discussion
We found weak evidence for a higher rate of neurological signs in the largest group of siblings of patients with schizophrenia examined to date. Subtle differences between sibling and comparison groups remained after we controlled for ethnicity and medication use. Of the two standard scales, the screened score from the Woods Scale
(32) was more sensitive for detecting differences than the score on the Neurological Evaluation Scale
(31). The relative risk of neurological signs in siblings was in the low to moderate range, suggesting a possible genetic component. However, relative risk values for the siblings of patients with a relatively high rate of soft neurological signs were generally higher than the relative risk values for the entire sibling group, providing stronger evidence of a familial component, although it is less certain that the greater risk is correlated with genetic risk for schizophrenia. Correlations with several other intermediate phenotypes were low, suggesting that neurological signs represent an independent, familial dimension of risk for schizophrenia.
Differences between our sibling and comparison groups were generally smaller than those reported previously
(20,
21,
43,
44). Several factors could account for this, such as different ascertainment strategies and exclusion criteria (e.g., alcohol abuse). For example, one study preferentially selected siblings with greater family psychopathology
(20). Another study found very high rates of signs in first-degree relatives (up to 38.1% versus 2.1% in a comparison group) but included parents, who were 10 years older on average than comparison subjects
(44). One study of 21 siblings (most of whom where male) had markedly greater effect size, despite the exclusion of siblings with schizophrenia spectrum disorders
(43); it is unclear whether gender, ethnicity, composition of the comparison group, or other factors account for this finding.
The rates of neurological signs in our comparison subjects, who were screened to exclude neurological diagnoses, suggest that such signs are common in subjects with no genetic risk for schizophrenia, consistent with previous observations
(26). Differences between studies illustrate the potential impact of ascertainment issues on genetic approaches to brain dysfunction.
The results for handedness are generally consistent with previous studies
(38,
39). Differences between patient and comparison groups on the Edinburgh Handedness Scale and incidence of mixed handedness were not robust (p=0.06). Furthermore, no relationship was seen between mixed handedness and neurological signs. Rates of mixed and non-right-handedness were not higher in the sibling group. This suggests that mixed handedness is unrelated to neurological signs and does not have a major familial component, in contrast to predictions about abnormal cerebral lateralization and genetic risk for schizophrenia
(45,
46).
Regarding correlations with cognitive impairment, relatively little shared variance was observed between neurological signs, particularly those on the Woods Scale, and other putative intermediate phenotypes based on cognition. This suggests that, to the extent neurological signs could be useful in detecting susceptibility loci for schizophrenia, they may detect loci that are distinct from those associated with various dimensions of cognitive impairment. On the other hand, it is possible that the lack of correlation is due to measurement error. Although it is difficult to rule this out, the stability and reliability of these measures suggest this is not the case. Previous studies have primarily looked at correlations between cognition and neurological signs in patient groups (see reference
47 for discussion). Similar to these findings, we found that the Neurological Evaluation Scale scores correlated significantly with working memory, verbal memory, and attention in the patient group. The Woods Scale total and screened scores were not correlated with these measures (data not shown).
The data support several conclusions about the genetics of neurological signs and risk for schizophrenia. First, although differences between patient and comparison groups are very robust, this is not true for the sibling group, which had a slightly higher rate of neurological signs than the comparison subjects. Although the relative risk was higher for the Woods Scale, this is considered a weak effect
(22,
23,
48). When extrapyramidal symptoms were excluded (i.e., screened scores on the Woods Scale), slight differences remained between groups, and relative risk was reduced. Although our estimates of relative risk may be somewhat biased downward
(27), they do suggest that this phenotype may have somewhat limited power for detecting susceptibility genes for schizophrenia. On the other hand, the moderate and higher relative risk values for high-risk siblings of patients with high scores indicate that there is a familial component to neurological signs, which could be partly genetic or environmental. Such factors may modify the expression of schizophrenia in these families but are not as clearly related to greater susceptibility for illness.
The robustness of these conclusions is dependent on the validity of the scales used and the meaning of soft neurological signs. Traditionally, neurological signs are used to localize pathology within the nervous system. However, many of the findings classified as soft signs are not readily localized. For example, skewed eye placement in the primary position could be indicative of extraocular muscle, peripheral nerve, or brainstem pathology. Some soft signs, such as mirror movements, are difficult to localize at all. In subjects with schizophrenia the problem is compounded by the absence of a typical profile of soft signs, which are spread out across the neurological domain. Although some signs are more clearly associated with pathology in a specific brain region
(33,
34) than others, our attempts to lump together signs referable to a specific brain region, similar to what has been done in previous studies
(36), did not produce a marked increase in relative risk. One possible exception are dyskinesias, which have been seen in previous studies of family members
(20,
44). The neurobiology of dyskinesia can be explicated, making candidate gene studies more credible. Indeed, several studies have reported an association between tardive dyskinesia and a polymorphism in the dopamine D
3 receptor gene
(49,
50). An obvious problem is that dyskinesia measurements are confounded by medications and fluctuate markedly over time.
In conclusion, we tested the hypothesis that several scales assessing neurological signs identify intermediate phenotypes that could improve the power of genetic studies of schizophrenia. We found that items on the Woods Scale are more prevalent in siblings of patients with schizophrenia but that when the effects of medication were removed, the effect size was fairly small and the relative risk was low. Although perhaps limited in power for detecting susceptibility loci, neurological signs, because they are more common in siblings who do not have schizophrenia, offer concrete support that susceptibility genes for schizophrenia have a detectable impact on signs of brain malfunction, in contrast to other phenotypic measures that often depend on understanding instructions, motivation, and other potential confounding factors. Thus the genetics of schizophrenia may overlap with the genetics of normal brain function.
