This speculation has attracted recent attention because of functional, anatomical, and neuropathological reports of abnormalities in both frontal and temporal brain regions. For example, many in vivo magnetic resonance imaging (MRI) studies have shown volume deficits in frontal and temporal gray matter
(5–
7), although neuropathologic studies show more mixed results, with some showing abnormalities in the number and/or density of cells in various prefrontal regions (e.g., references
8,
9) and others not showing brain abnormalities in these regions (e.g., reference
10). There is also evidence from studies of regional cerebral blood flow that functional connectivity between these two brain regions might be abnormal in schizophrenia
(11,
12). These latter studies have demonstrated that patients with schizophrenia have a failure of deactivation in the temporal lobes that is normally associated with activation of the dorsolateral prefrontal cortex during a verbal fluency task (finding replicated in a functional MRI study
[13] but not replicated by the same authors in a different study group
[14]). Some investigators
(11,
15) have also tried to characterize the nature of the disruptions in connectivity by attributing them to late stages of myelination. Moreover, Deakin and Simpson
(2) hypothesized that genetically transmitted abnormalities in the development of the ventral frontal lobe may lead to a progressive degeneration of its projections coursing through the uncinate fasciculus to the temporal lobe. Finally, MRI structural studies
(16,
17) have shown an association between volume reduction of the prefrontal cortex and temporal lobe in schizophrenia.
There is, however, a lack of direct in vivo evidence of abnormal connectivity between the frontal and temporal brain regions in schizophrenia as evinced by abnormalities in the fiber bundles connecting the two regions. This is not surprising given that conventional MRI studies are not suitable for visualizing fiber tracts. In contrast, diffusion tensor imaging
(18) is an MRI technique that can detect subtle white matter abnormalities in vivo by assessing the degree to which directionally organized tissues have lost their normal integrity. This technique is based on sensitizing the MR signal to the movement of water and determining the magnitude and direction of the water diffusion in three dimensions. In white matter, diffusion perpendicular to the direction of axons is restricted by myelin sheath and cell membrane such that diffusion is greater along the length of the axon than perpendicular to it. In contrast, in CSF and gray matter, water diffusion is random and equal in all directions. This characteristic of the diffusion (differing according to the medium’s relative orientation) is termed “anisotropy.” The estimation of the diffusion tensor, a mathematical entity that characterizes water diffusion in all directions, has been proposed as an effective measure of diffusion in anisotropic tissue. In addition, several scalar measures describing the extent to which diffusion is anisotropic, indicating the presence of directional bias of the diffusion, have been proposed. The most popular are fractional anisotropy and relative anisotropy indices
(19); the fractional anisotropy index has a slightly better signal-to-noise ratio than the relative anisotropy index
(20). Higher anisotropy indices indicate greater directionality and coherence of the fiber tracts, while lower anisotropy indicates less directionality and more random movement of water in all directions measured.
This method has been used to discern the directionality of white matter tracts in the normal human brain
(21) and to evaluate white matter fiber integrity in multiple sclerosis
(22), stroke
(23), and Alzheimer’s disease
(24). Of note, the first three studies to quantify anisotropic diffusion in patients with schizophrenia showed lower anisotropy within prefrontal white matter
(25), in whole-brain white matter
(26), and in the splenium of the corpus callosum
(27) than in comparison subjects. None of these studies, however, focused on specific temporal-frontal fiber tracts in schizophrenia, as proposed here. In this study, we applied line-scan diffusion tensor imaging
(28) to obtain fractional anisotropy maps for 15 patients with schizophrenia and 18 comparison subjects in order to measure the integrity of fibers within the uncinate fasciculus, the most prominent of all white matter fiber tracts connecting the frontal and temporal lobes.
Method
Subjects
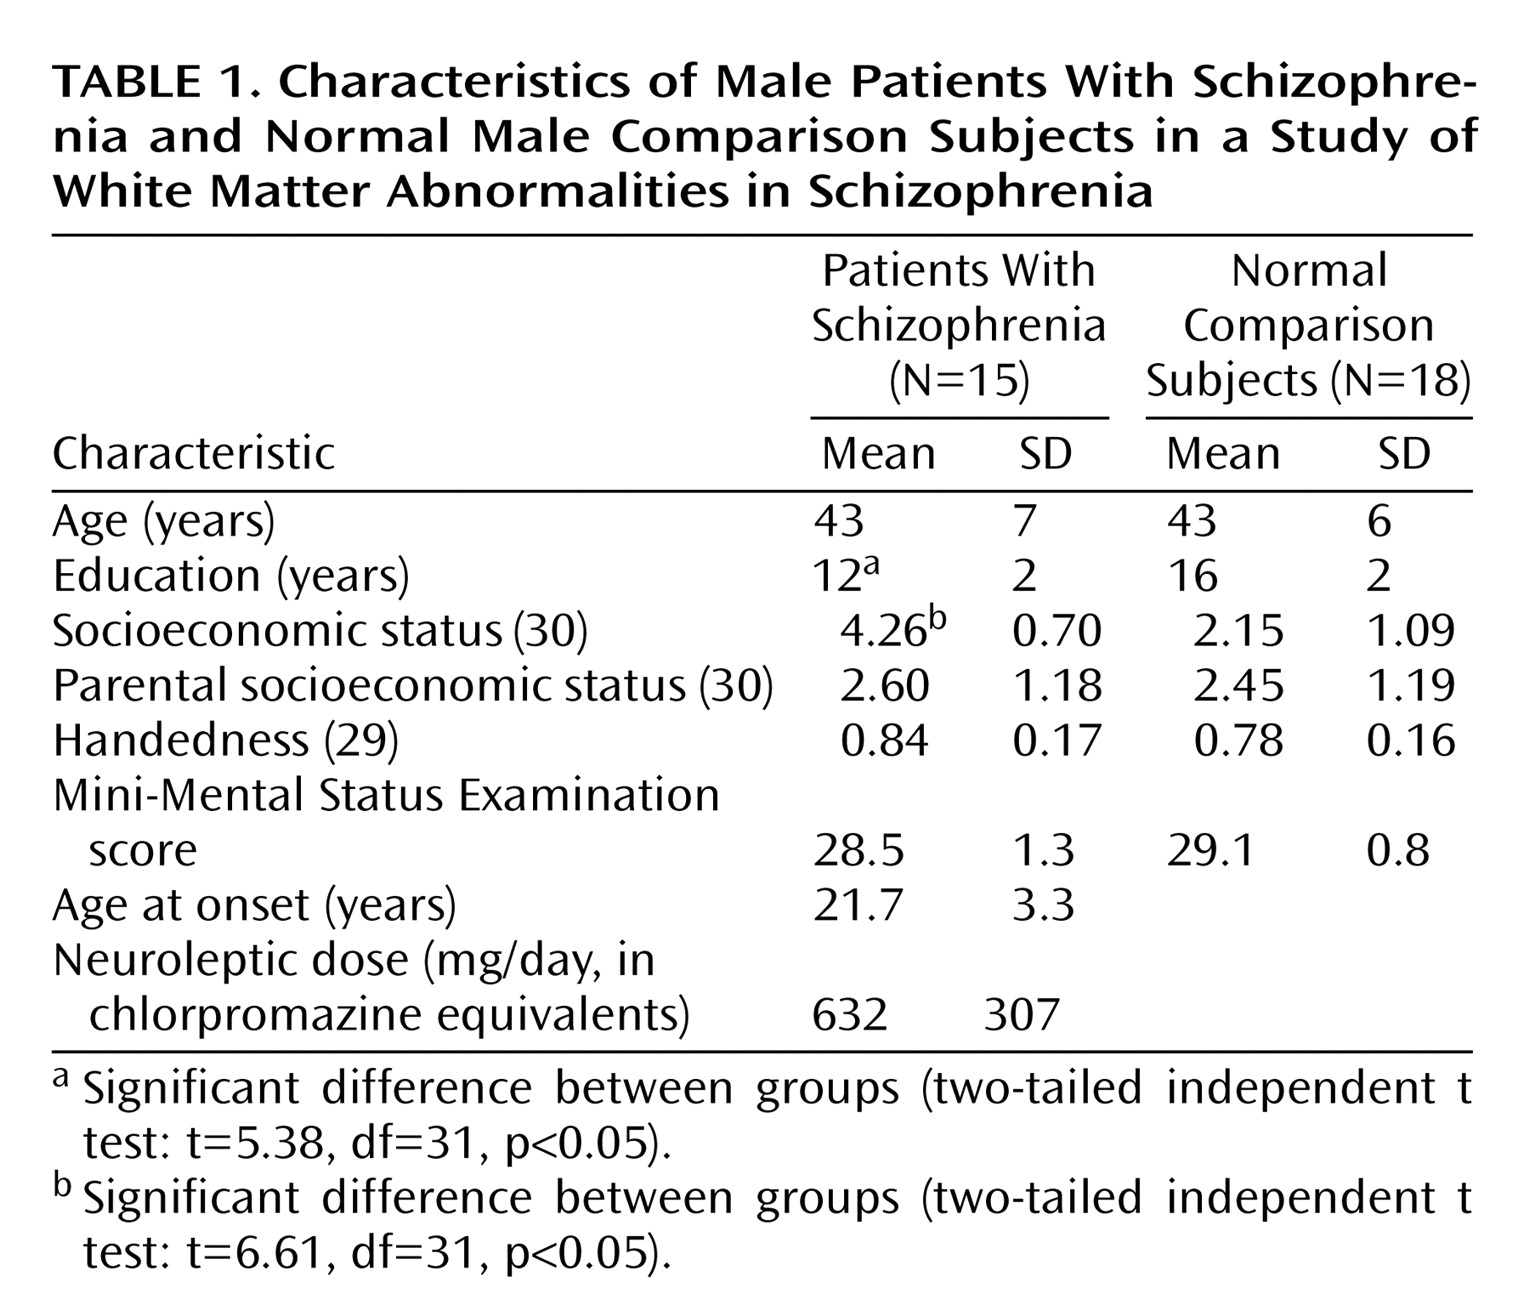
Fifteen patients with schizophrenia were recruited from inpatient, day treatment, outpatient, and foster care programs at the VA Boston Healthcare System, Brockton, Mass. Assessments with the Structured Clinical Interview for DSM-IV—Patient Version (SCID) were used to make DSM-IV diagnoses, and the nonpatient edition of the SCID was completed for 18 normal comparison subjects.
The comparison subjects were recruited from the general community and were group-matched to the patients on age, sex, handedness
(29), and parental socioeconomic status
(30).
The inclusion criteria for all subjects were right-handedness, age between 17 and 55 years, no history of electroconvulsive shock treatment, no history of neurological illness, no alcohol or drug abuse in the last 5 years, no medication with known effects on MR (such as steroids), a verbal IQ above 75, and an ability and desire to cooperate with the procedures as evidenced by written informed consent. In addition, the comparison subjects were screened to exclude individuals who had a first-degree relative with an axis I disorder.
Clinical Measures
As part of a comprehensive neuropsychological battery, all subjects were evaluated by means of the verbal paired associate learning subtest of the Wechsler Memory Scale—3rd ed. (WMS)
(31), the Wisconsin Card Sorting Test
(32), the Trail Making Test, and the similarities subtest of the WAIS-III
(33). This subset of neuropsychological tests was selected because in prior studies in our laboratory
(32), poor performance on them was correlated with reduced volume of either temporal or frontal lobe regions, as assessed by conventional MRI, in patients with schizophrenia. We used these tests to assess the functional significance of the uncinate fasciculus in patients with schizophrenia.
MRI Protocol
All subjects were scanned by means of line-scan diffusion tensor imaging, a technique that can be implemented on conventional MR scanners
(28). Unlike the single-shot
(34) and navigated echo
(35) echo-planar imaging, the most commonly used MR diffusion imaging techniques, by which a whole volume or whole slice is acquired at once, line-scan diffusion tensor imaging is composed of a series of parallel columns lying in the image plane. The sequential collection of these line data in independent acquisitions makes the sequence largely insensitive to bulk motion artifact since no phase encoding is used and shot-to-shot phase variations are fully removed by calculating the magnitude of the signal. In addition, the existing movement artifacts can be easily removed, since interpolation is much easier for a missing line than for a missing slice or volume.
MR scans were performed with a quadrature head coil on a 1.5-T GE Echospeed system (General Electric Medical Systems, Milwaukee), which permits maximum gradient amplitudes of 40 mT/meter. We began with a set of three orthogonal T1-weighted images used as localizers: sagittal, axial aligned to the anterior commissure–posterior commissure (AC-PC) line, and another sagittal aligned to the interhemispheric fissure. From the last sagittal T1-weighted image, the line-scan diffusion tensor imaging sequence in the coronal orientation was then aligned to the AC-PC line. For each line, six images with high diffusion weighting (1000 sec/mm2) along six directions were collected. For low diffusion weighting (5 sec/mm2) we collected only two images, since diffusion-related signal changes are minimal. The following scan characteristics were used: rectangular field of view, 220×165 mm; 128×128 scan matrix (256×256 image matrix); slice thickness, 4 mm; interslice distance, 1 mm; receiver bandwidth, ±4 kHz; TE (echo time), 64 msec; effective TR (repetition time), 2592 msec; scan time, 60 sec/slice section. We acquired a total of 31–35 coronal slices covering the entire brain, depending on brain size. The total scan time was 31–35 minutes.
After reconstruction, the diffusion-weighted images were transferred to a workstation, where eigenvalue, eigenvector, and fractional anisotropy maps of the diffusion tensor were calculated. Motion-related artifact maps were also constructed.
Quantification and Statistical Analysis
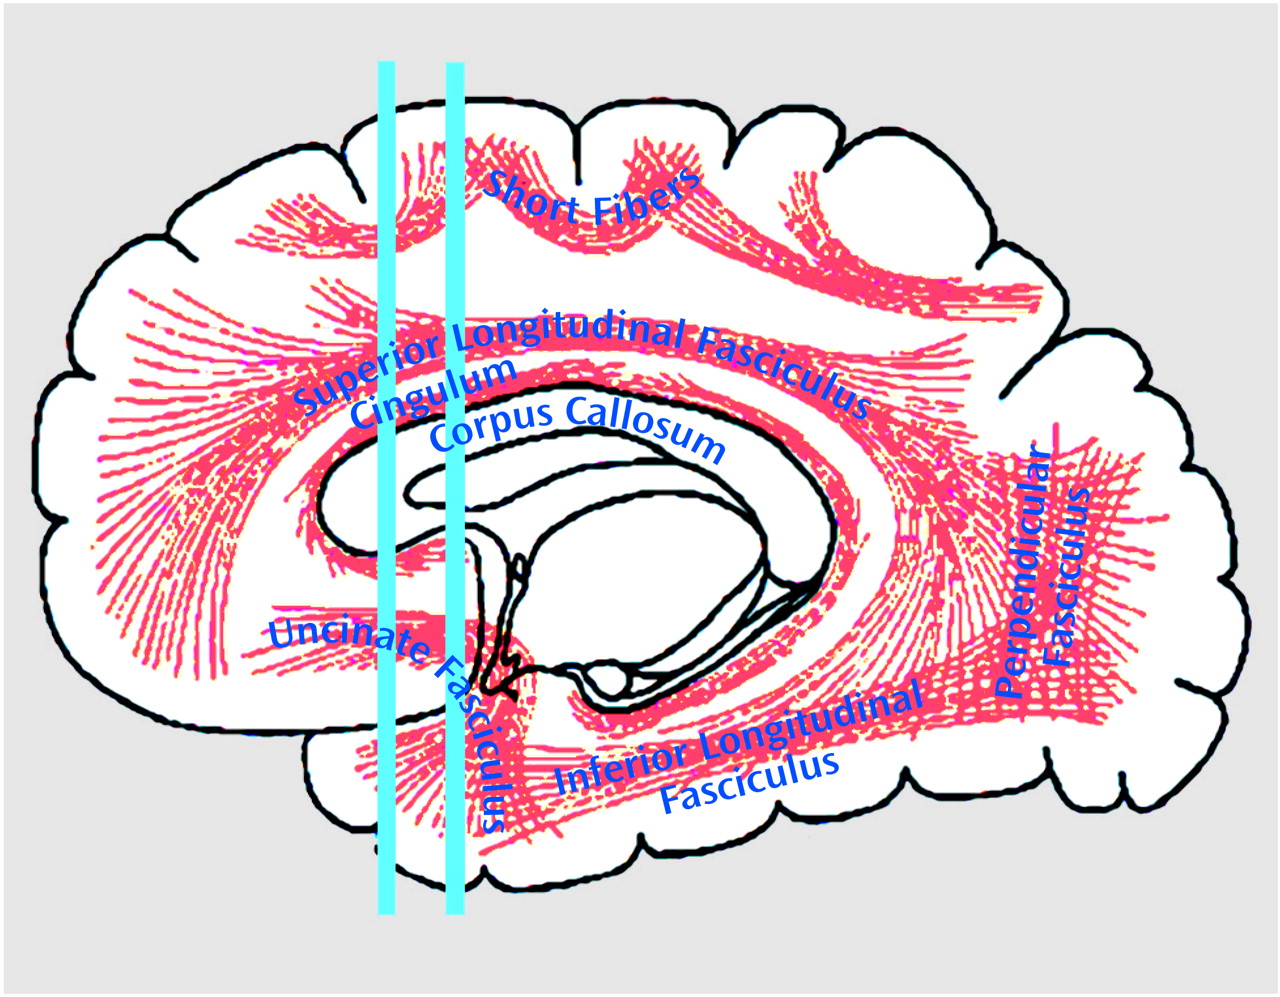
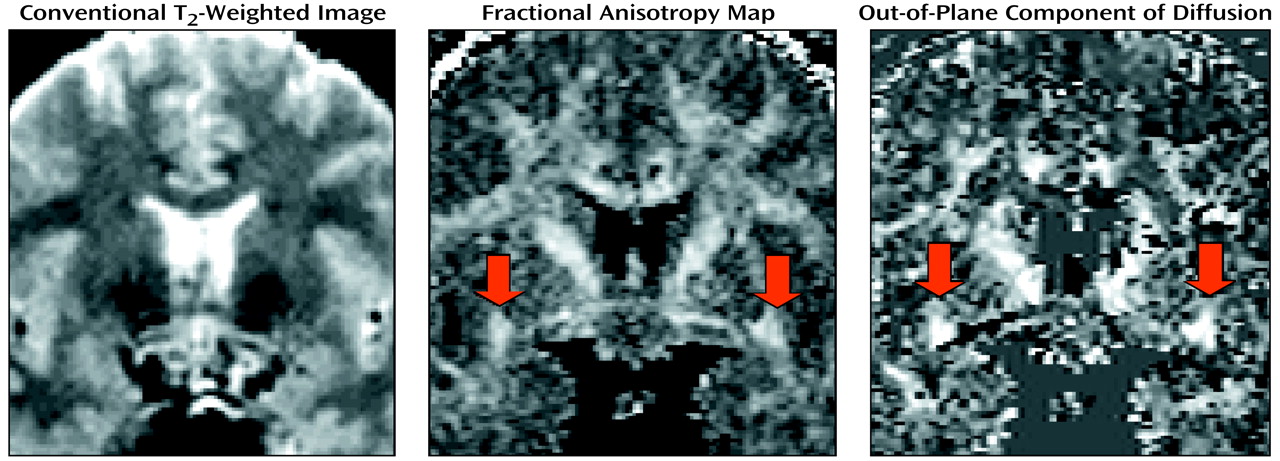
To quantify uncinate fasciculus diffusion, we used one coronal slice, perpendicular to the AC-PC line, that intersects the uncinate fasciculus in the temporal stem—the densest portion of this fiber tract (
Figure 1 and
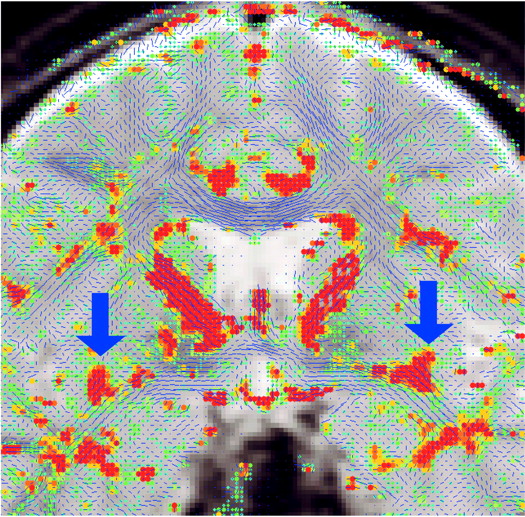
Figure 2). The uncinate fasciculus in this location is parallel to the AC-PC line and appears visible on only one slice in the segmentation defined by the maximum diffusivity (λ1, the largest eigenvalue of the diffusion tensor) (
Figure 3). All measurements were done by one of us (M.K.) while blind to diagnostic group.
For each subject, a point centered within each fiber tract (separately for left and right) was selected, and fractional anisotropy (which describes deviation from the isotropic diffusion) was calculated by using the following formula
(19):

As we were interested in the extent to which anisotropy differences between groups reflect the degree of connectivity between the frontal and temporal lobes, we also measured the area of the uncinate fasciculus, derived from the maximum diffusivity segmentation (1×10⁻³ mm2/sec was used as the fixed threshold for all the cases; greater area in the presence of greater anisotropy should represent more interconnecting fiber tracts), and we measured the sum of fractional anisotropy for the entire area. In addition, as the manual selection of a point could potentially bias the measurement, the point with the maximal fractional anisotropy value within the uncinate fasciculus was also automatically calculated.
To examine motion artifact, we calculated the degree of motion-related artifacts within the segmented region of interest. This measure was defined as the number of lines missing in the raw line-scan diffusion tensor imaging data (six directed diffusion images).
Repeated measures analysis of variance (ANOVA), with group as a between-subjects factor and side as a within-subjects factor, were used to test for group differences in uncinate fasciculus diffusion. In the case of a significant group-by-side interaction, independent t tests were used to compare group differences, separately for the right and left hemispheres, and paired t tests were used within each group to test for hemispheric asymmetry differences in diffusion. Associations between neuropsychological test results and diffusion measures were evaluated by using Spearman rank-order correlations. Because our correlations were hypothesis driven, we did not correct for multiple comparisons; however, we conservatively considered only p values below 0.01 (two-tailed) as significant.
Discussion
We here report an asymmetry (left greater than right) in uncinate fasciculus anisotropic diffusion in normal male subjects, which was not evident in male patients with chronic schizophrenia. This result was obtained by measuring fractional anisotropy within the uncinate fasciculus, and it was confirmed by measures of the area of the uncinate fasciculus and by the sum of fractional anisotropy for the entire area, derived from an automated segmentation. To our knowledge, this result has not been previously reported in the literature.
The asymmetry of uncinate fasciculus diffusion anisotropy in the comparison subjects may reflect structural and functional differences between the two hemispheres that are neurodevelopmental in origin. Such asymmetries have been documented in several brain regions, including the Sylvian fissure
(37), planum temporale
(38), and frontal operculum
(37), during the second and third trimesters of gestation. Many of these asymmetry differences may be relevant to specialized functions of the brain, which are lateralized in humans, such as language (e.g., references
39,
40). The greater anisotropy found in the left than in the right uncinate fasciculus in normal subjects in our study may indicate a higher number and/or density of fibers in the left uncinate fasciculus than in that on the right.
The uncinate fasciculus is the largest of the three big fiber bundles connecting the frontal and temporal lobes; the other two are the cingulate and the superior longitudinal fasciculus. The absence of asymmetry in schizophrenia suggests a significant abnormality in the integrity of the fiber tracts connecting the frontal and temporal lobes. Not known, however, is how this lack of normal asymmetry might be understood vis-à-vis the pathophysiology of schizophrenia. For example, abnormalities in anisotropy within white matter might be explained by abnormalities in the number and/or density of the interconnecting fiber tracts or by abnormalities in myelination
(41). In addition, differences in anisotropy between schizophrenia patients and comparison subjects might be explained by a lack of, or a loss of, coherence of white matter fiber bundles traveling between two distinct brain regions, affecting the connectivity between these regions. Thus, an abnormality in one or in a combination of these features might be manifest in a loss of asymmetry, as we report here in schizophrenia.
There are several candidate pathological processes that might influence the integrity of white matter fiber connections between frontal and temporal regions. For example, Akbarian et al.
(42) reported an abnormal distribution of interstitial neurons in prefrontal and temporal regions in schizophrenia, which they attributed to the disruption of fetal brain development and failure of neuron migration during the second trimester of pregnancy, thereby affecting the ingrowth of connections to the cortex. The higher number of neurons in schizophrenia might therefore adversely affect the number and organization of their possible axonal projections and, consequently, water diffusion within the white matter tracts, as measured by diffusion tensor imaging.
In addition, Deakin and Simpson
(2) suggested that neurochemical, histological, and functional abnormalities in schizophrenia most likely reflect progressive degeneration of projections from the ventral frontal to the anterior temporal lobe. They suggested that dysplastic cellular architecture in the ventral frontal cortex gives rise to projections to the temporal cortex, which are vulnerable, as a consequence of their dysplastic origins, to some extrinsic and intrinsic pathological processes. These speculations, in conjunction with their report of left-lateralized glutamate uptake sites in the polar temporal cortex of patients with schizophrenia
(43), are consistent with our finding of changes in uncinate fasciculus diffusion anisotropy in schizophrenia.
The results reported here are also consonant with MRI
(44) and postmortem
(45) findings suggesting an absence of normal brain asymmetry in schizophrenia. According to Crow et al.
(46), who posited a “lateralization hypothesis of schizophrenia,” abnormal neural development of brain lateralization is critical to the etiology of schizophrenia. They stated that the left hemisphere may be more vulnerable to insult or damage because it develops later than the right hemisphere (see also reference
39) and that this damage might occur in schizophrenia. If such damage occurs in white matter, it might affect white matter fiber tracts as measured by diffusion tensor imaging.
Differences in brain development are also the focal point of work by Benes and co-workers
(47), who suggested that myelination in specific brain regions (especially the frontal and temporal lobes, where myelination still occurs in the second decade of life) might play a neuroprotective role, particularly with respect to the timing of the appearance of symptoms in individuals at risk for schizophrenia. In addition, in a study using magnetization transfer contrast imaging, which measures the myelin component of white matter
(48), the myelin component of fibers in the temporal lobe was lower in patients with schizophrenia. Thus, it is possible that schizophrenia patients have an abnormality of myelin. As myelin sheaths form linear structures surrounding and insulating axons, their integrity and thickness influence the water diffusion within the brain, and measures of diffusion might reflect such alterations
(41).
Other diffusion tensor imaging studies have also shown anisotropy abnormalities in schizophrenia. Lim and co-workers
(26), for example, using a measure of fractional anisotropy averaged over large regions of interest, reported widespread lower anisotropy in patients with schizophrenia than in normal subjects. Buchsbaum et al.
(1), using methods based on statistical probability maps, reported lower relative anisotropy (another index of anisotropy with a slightly different scaling parameter) within the left prefrontal white matter region in schizophrenia. Finally, Foong et al.
(27) reported lower anisotropy within the splenium but not genu of the corpus callosum in schizophrenia patients than in comparison subjects, determined by using small region-of-interest averaging techniques and fractional anisotropy.
These findings, taken together, provide strong evidence for loss of integrity within the white matter fiber tracts in schizophrenia. The question remains, however, as to whether it is the same widespread pathological process affecting the whole white matter or whether the process is more localized, affecting several white matter fiber tracts. A further question is whether the anomaly is primary and due to loss of gray matter volume or secondary to the regional abnormalities within gray matter areas interconnected by the fiber tract, as several MR structural studies have shown abnormalities of orbitofrontal and temporal pole volume in schizophrenia, specifically reduced volume in patients with chronic schizophrenia
(49) and increased volume on the right side in subjects with first-episode schizophrenia
(50) in the orbital frontal region and volume reduction within the temporal pole in schizophrenia subjects
(7,
51) when compared with normal comparison subjects.
With respect to correlations with clinical measures, the diffusion tensor imaging measures correlated in expected ways with neuropsychological measures in the patients with schizophrenia. That is, poor performance on a measure of visual attention correlated with right-sided white matter abnormalities, whereas poor verbal associative memory correlated with left-sided white matter abnormalities. These correlations between neuropsychological performance and measures of connectivity suggest the presence of a disruption in frontal-temporal functional connectivity.
A possible limitation of our study is the small number of subjects, although, to date, most diffusion studies in schizophrenia have been based on relatively small study groups. In addition, our study suggests that motion artifact in diffusion tensor imaging studies may be an issue. Although line-scan diffusion tensor imaging is less sensitive to movement artifacts than is echo-planar imaging
(28), one might still want to examine motion artifacts as a potential confound.
While the expected direction of the fiber tracts in the uncinate fasciculus is anterior-posterior, fibers traveling in other directions might decrease the diffusion anisotropy within our region of interest. Hanyu et al.
(24), who calculated anisotropy diffusion within the temporal stem in patients with Alzheimer’s disease, noted that fiber bundles crossing the anterior commissure might be an additional source of alterations in diffusion anisotropy within the anterior temporal region. Analogously, it is possible that other fibers crossing the uncinate fasciculus within our region of interest could decrease anisotropy findings
(19), although we would expect to find this effect in both groups equally.
In summary, we believe that this study presents new findings relevant to the status of white matter tracts in schizophrenia. We were able to evaluate directly in vivo fiber tracts of the uncinate fasciculus, a bundle of fibers that might play an important role in the pathology of this disorder. Our study revealed disruptions in connectivity between the frontal and temporal lobes that were marked by a significant loss of normal left-greater-than-right asymmetry in patients with schizophrenia. Further studies are needed to determine the exact functional role of the uncinate fasciculus and the implications of abnormalities in this white matter fiber tract in schizophrenia.

