Increases in CSF—including lateral and third ventricular enlargements, sulcal widening, and larger CSF-to-brain tissue ratios—are the most frequently observed neuroanatomic abnormalities in schizophrenia
(1–
3). Although CSF increases, first recognized in pneumoencephalographic and computed tomography studies
(4,
5), are well replicated in schizophrenia, the regional specificity of extracortical CSF increases are not well characterized, despite the improved spatial resolution of magnetic resonance imaging (MRI) techniques. Some MRI studies, however, have shown localized sulcal CSF increases in frontal and temporal regions
(6,
7), although others have observed extracortical CSF enlargements in all brain regions
(8,
9).
Cortical gray matter deficits have also been observed in schizophrenia, as documented in qualitative and quantitative reviews of the structural imaging literature, although findings are somewhat less consistent
(3,
10–12). Cortical gray matter deficits in the temporal lobe, particularly the superior temporal gyrus
(13–
16) and medial temporal regions
(17,
18), are well replicated in schizophrenia. Gray matter deficits in parietal, orbitofrontal, and mesiofrontal regions have also been reported with some frequency
(19–
21), although deficits in prefrontal and occipital regions are less consistently observed
(3). Effect sizes obtained from pooling data across studies, however, suggest that global or regional differences in cortical gray matter volume are small
(10,
22). Inadequate statistical power may therefore contribute to the relative frequency of negative findings.
Several other factors may compromise the ability to recognize small and regional differences in tissue distributions linked with schizophrenia. For example, different interactions between harmful environmental or polygenetic factors, potentially underlying the heterogeneous clinical manifestation of the disease, may interfere with attempts to identify local brain abnormalities that reflect an overall diagnostic specificity. Furthermore, enormous variation exists in normal brain structure that has been associated with individual differences such as biological sex
(23–
25), age
(23,
26), and handedness
(25,
27,
28) as well as the unique contributions of genetics and experience
(29,
30). Possible interactions between these factors and those associated with disease processes may compromise the ability to recognize regional differences in tissue distributions that distinguish schizophrenia patients from healthy subjects. For example, gender differences, present in the clinical manifestation of the disease (i.e., age at onset), are also documented with respect to brain abnormalities
(31,
32). Aging effects, as investigated in cross-sectional and longitudinal studies, suggest a progressive loss of gray matter, particularly in frontal and temporal regions, and pronounced CSF increases in schizophrenia patients relative to healthy subjects
(33–
37), although negative findings exist.
Brain mapping methods capable of matching structurally or functionally homologous brain regions between subjects may serve to increase power by reducing noise associated with the well-documented variability in brain structure between individuals. Matching corresponding cortical surface locations between subjects may therefore help to dissociate subtle and spatially diffuse differences in regional tissue volumes that may exist in schizophrenia. In this study, we employed such methods to isolate regional differences in tissue proportions (gray matter and CSF) surrounding the cortex in patients with chronic schizophrenia compared with healthy subjects. This methodological approach has been used in two published schizophrenia studies. The first study demonstrated an accelerated pattern of gray matter loss in childhood-onset patients relative to comparison subjects
(38). The second investigation compared monozygotic and dizygotic twins discordant for chronic schizophrenia along with demographically matched control twins and showed highly significant differences surrounding prefrontal and temporal cortices that were interpreted to reflect genetic and disease-specific schizophrenia-related reductions in cortical gray matter
(39). The results from these two studies, however, warrant further investigation for several reasons. First, childhood-onset schizophrenia patients may possess a more severe form of the disorder
(40) and thus exhibit pronounced gray matter deficits and maturational/aging effects compared with patients with a more typical onset. Second, if aging effects are pronounced in schizophrenia, such effects may have contributed toward the positive results observed in the schizophrenia twin study
(39). Finally, in the schizophrenia twin study, tissue-sampling measurements included voxels from nonbrain tissue such that group differences attributable to extracortical CSF or scalp and meninges classified as “gray matter” likely influenced results.
In our study, we set out to confirm whether regional differences in cortical gray matter are present in adult-onset patients with chronic schizophrenia compared with healthy subjects after editing nonbrain tissue from each MR volume and employing cortical pattern-matching methods to resolve individual differences in anatomy. The same methods were employed to examine the regional specificity of extracortical (sulcal and subarachnoid) CSF increases in schizophrenia. For both measures, the modulating effects of biological sex and age were examined. Diagnosis, sex, and aging effects were also examined for intracranial volumes, whole brain volumes (including sulcal CSF only), and intracranial gray matter, white matter, and CSF. Statistical relationships between measures were later assessed.
Method
Subjects
Twenty-five chronic schizophrenia patients (15 men and 10 women) and 28 healthy subjects (15 men and 13 women) were scanned at the Institute of Psychiatry in London. Other demographic and clinical details are summarized in
Table 1. Groups did not differ significantly in age (range=20 to 58 years), years of education, height, or parental socioeconomic class. Duration of illness, however, was significantly longer in female than in male patients (t=2.26, df=23, p<0.03). Socioeconomic status was derived from the Office of Population Censuses and Surveys
Standard Occupational Classification (41) using details of “best-ever” parental occupation. Both groups had one male and one female subject who were left-handed according to the Annett Handedness Scale
(42). All schizophrenia patients met DSM-III-R criteria and were receiving regular antipsychotic medication. Healthy subjects were screened for any personal or family history of psychiatric illness. Exclusion criteria for both patients and comparison subjects were head trauma, drug abuse, and hereditary neurological disorders. All subjects gave informed written consent for participation with ethical permission obtained from the Bethlem and Maudsley Ethical Committee (Research).
Image Analysis Procedures
High-resolution three-dimensional spoiled gradient recall acquisition MR images (256×256 matrix; 20-cm field of view) were acquired on a GE Signa 1.5-T scanner as a series of 124 contiguous 1.5-mm coronal slices and were corrected for signal intensity inhomogeneities
(43,
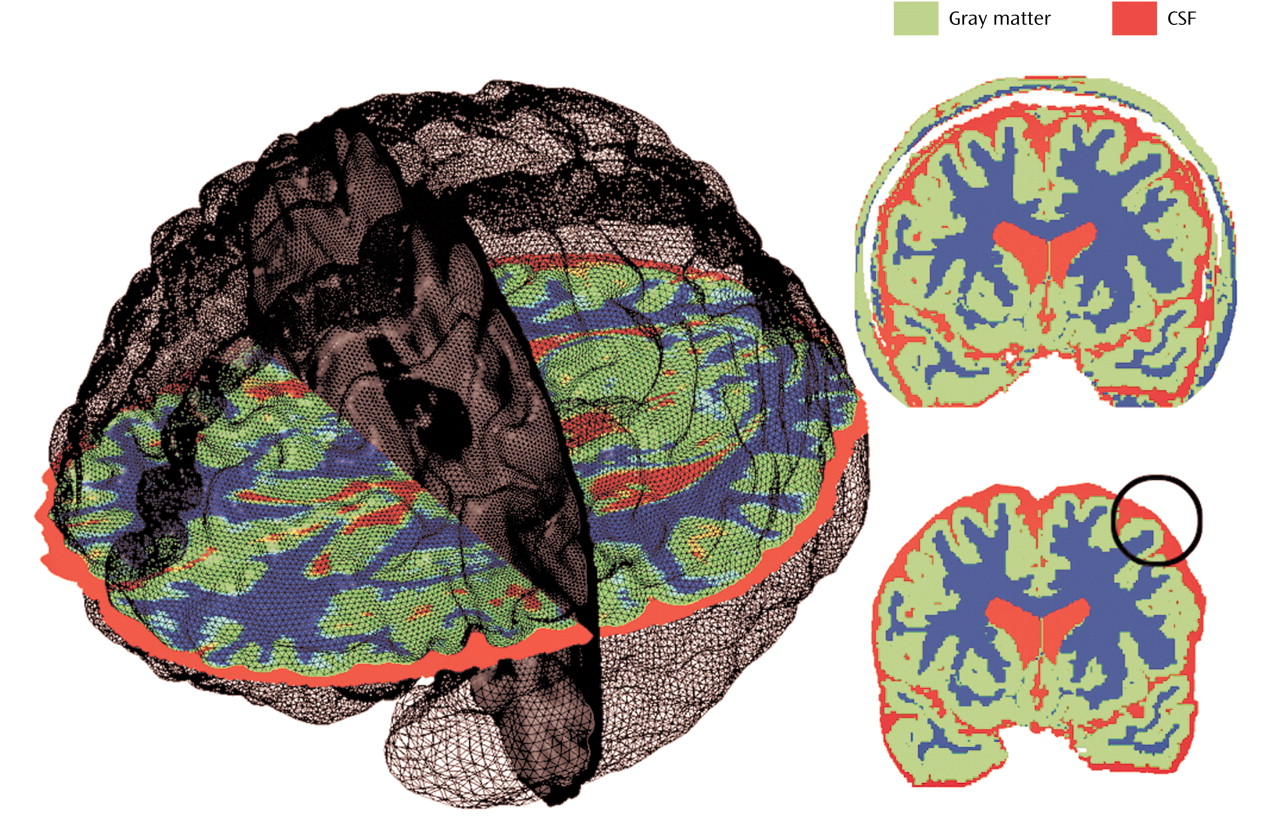
44). Nonbrain tissue including the scalp, bone, and meninges was manually edited from each brain slice such that only brain tissue and subarachnoid and sulcal CSF remained in each image volume (
Figure 1). These scalp-edited MRI volumes were used to estimate intracranial brain volume and for tissue segmentation
(45,
46) providing volumes of intracranial gray matter, white matter, and CSF in native scanner space. Brain volumes were also measured after including sulcal CSF only (i.e., without extrasulcal subarachnoid CSF). Reliability of manual scalp editing was determined by calculating the intraclass correlation coefficients for brain volumes from 10 test brains that were randomly mixed in among a larger data set and edited by the same raters (S.K. and D.A.). Intra- and interrater reliabilities of manual editing were excellent (r>0.99).
Cortical Surface Averaging
For interindividual and group comparisons of surface anatomy we used a two-point anterior-posterior commissure registration to correct for differences in the relative position and orientation of each brain volume and to place scalp-edited MR volumes into a common coordinate space as previously described
(30,
47–49). This method for registering anatomy has been validated for comparing morphometry between normal and diseased populations
(50–
52).
Parametric models of the cortex were extracted from each MR volume (53) and used to outline 38 primary cortical sulci and fissures employing validated anatomic delineation protocols (http://www.loni.ucla.edu/~esowell/new_sulcvar.html)
(38,
47,
54). Interrater reliability of manual outlining was measured as the three-dimensional root mean square difference in millimeters between 100 equidistant points from each sulcal landmark in six test brains that were traced by one rater (K.L.N.) and compared with a gold standard arrived at by a consensus of raters (E.R.S. and D.R.). Intrarater reliability was computed by comparing the three-dimensional root mean square distance between equidistant surface points from each sulcal landmark traced six times in one test brain by the same rater (K.L.N.). Three-dimensional root mean square distance was <2 mm, and on average <1 mm, for all landmarks within raters and relative to the gold standard.
Sulcal/gyral landmarks and the cortical surface models from each subject were used to compute a three-dimensional vector deformation field, which reconfigures each subject’s anatomy into the average pattern of a given group. Briefly, a surface-warping algorithm uses the sulcal landmarks as anchors to drive the surrounding cortical surface anatomy from each individual into correspondence. This surface-matching procedure records the amount of x, y, and z coordinate shift (or deformation) at all cortical surface points between individuals, thus associating homologous cortical regions between subjects
(30,
49).
Tissue Proportion Measurements
The three-dimensional deformation vector fields obtained from the cortical pattern-matching methods allow a local measurement of gray matter or CSF to be made at equivalent three-dimensional cortical surface locations in each subject, referencing corresponding point locations in spatially registered tissue-classified, scalp-edited brain volumes (
Figure 1). To quantify cortical gray matter, we measured the proportion (or density) of voxels segmenting as gray matter, relative to all other tissue types, within a sphere with a fixed radius of 15 mm, at homologous cortical surface points in each individual. Gray matter proportion measures thus represent values ranging from 0.0 (no gray matter voxels within the sphere) to 1.0 (all gray matter voxels) and provide a local estimate of gray matter volume within the cortical mantle in each individual. These measures are also consistent with postmortem cortical thickness distributions
(55), where gray matter thickness depends on the relative development of pyramidal and granular cells in the cortical layers. Intermediate proportions of gray matter are observed in homotypical areas, higher indices of gray matter are observed in agranular regions, and lower indices of gray matter are observed in granular sensory regions
(54,
56).
Extracortical CSF was estimated similarly by measuring the ratio of CSF voxels in the sulcal and subarachnoid space surrounding each cortical surface point, again using a sphere with a fixed radius of 15 mm. This measure thus estimates the amount of CSF in the sulcal and subarachnoid space at corresponding locations between individuals, with concentration again ranging from 0.0 to 1.0. For each point on the cortical surface, local measurements of gray matter or CSF were compared statistically between individuals to provide maps indexing extremely local differences in tissue proportions within and between groups
(38,
54).
Statistical Analyses
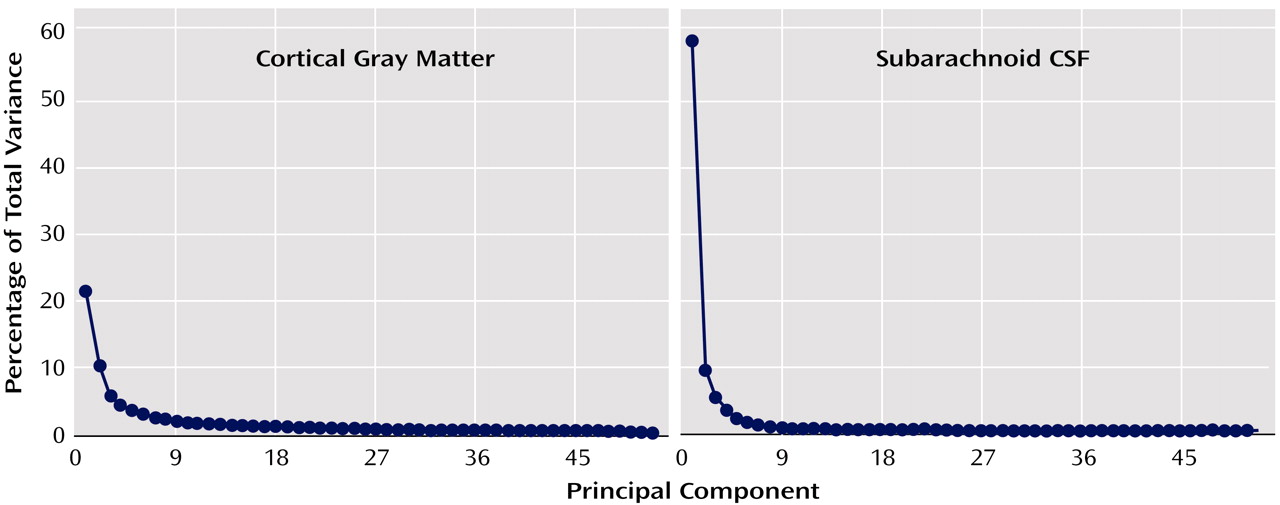
To circumvent the need to correct for statistical comparisons made at each cortical surface location (65,536 surface points), we first examined whether overall changes in cortical gray matter or subarachnoid CSF tissue proportions were present in association with diagnosis, sex, or age. We used principal-component analyses to reduce tissue proportion values measured at homologous cortical surface locations in each individual into components that explained the maximum amount of possible variance in the data for cortical gray matter and subarachnoid CSF proportion measures separately. Scree plots in
Figure 2 show the proportion of total variance accounted for by each of the principal components. The first components account for 58.9% and 21.5% of the total variance for subarachnoid CSF and cortical gray matter, respectively. Given the size of our study group, we decided a priori to examine only the first components. However, when the first component showed no schizophrenia effect, we performed follow-up tests on all components above the elbow (or bend) in the curve, as displayed in the Scree plots, to verify that negative results would have been obtained even with inclusion of additional components.
Factor scores from principal components were included as dependent variables in statistical analyses that used the general linear model. Diagnostic group (schizophrenia patients, healthy subjects) and sex (male, female) were included as categorical predictor variables, and age was included as a continuous predictor variable. All main effects and interactions between the predictor variables were included in the model. Only significant effects of principal-component analysis scores for either CSF or gray matter were followed up with statistical comparisons of tissue proportions at each cortical surface location to show the regional specificity of gray matter or CSF effects surrounding the cortex in three dimensions. Specifically, to identify regional differences, in tissue proportions between diagnostic groups, we used Student’s t tests to compare gray matter or CSF measures at each cortical surface point. Pearson correlation coefficients were used to assess associations between tissue proportion measures and age. The results of these tests were mapped onto three-dimensional, group-averaged cortical surface models by using the deformation fields described previously and colored to index statistically significant results.
We employed the same general linear model described for principal-component analysis factor scores to examine the effects of the predictor variables on intracranial, whole brain, and intracranial gray matter, white matter, and CSF volumes. Tissue volumes were corrected for individual differences in brain size by multiplying the ratio of the average intracranial volume to the individual’s intracranial volume. Finally, Pearson correlation coefficients were used to describe the relationships among principal-component analysis scores and brain tissue volumes. For all analyses, a two-tailed alpha level of 0.05 was used as the threshold for statistical significance.
Results
Intracranial, Brain, and Tissue Volumes
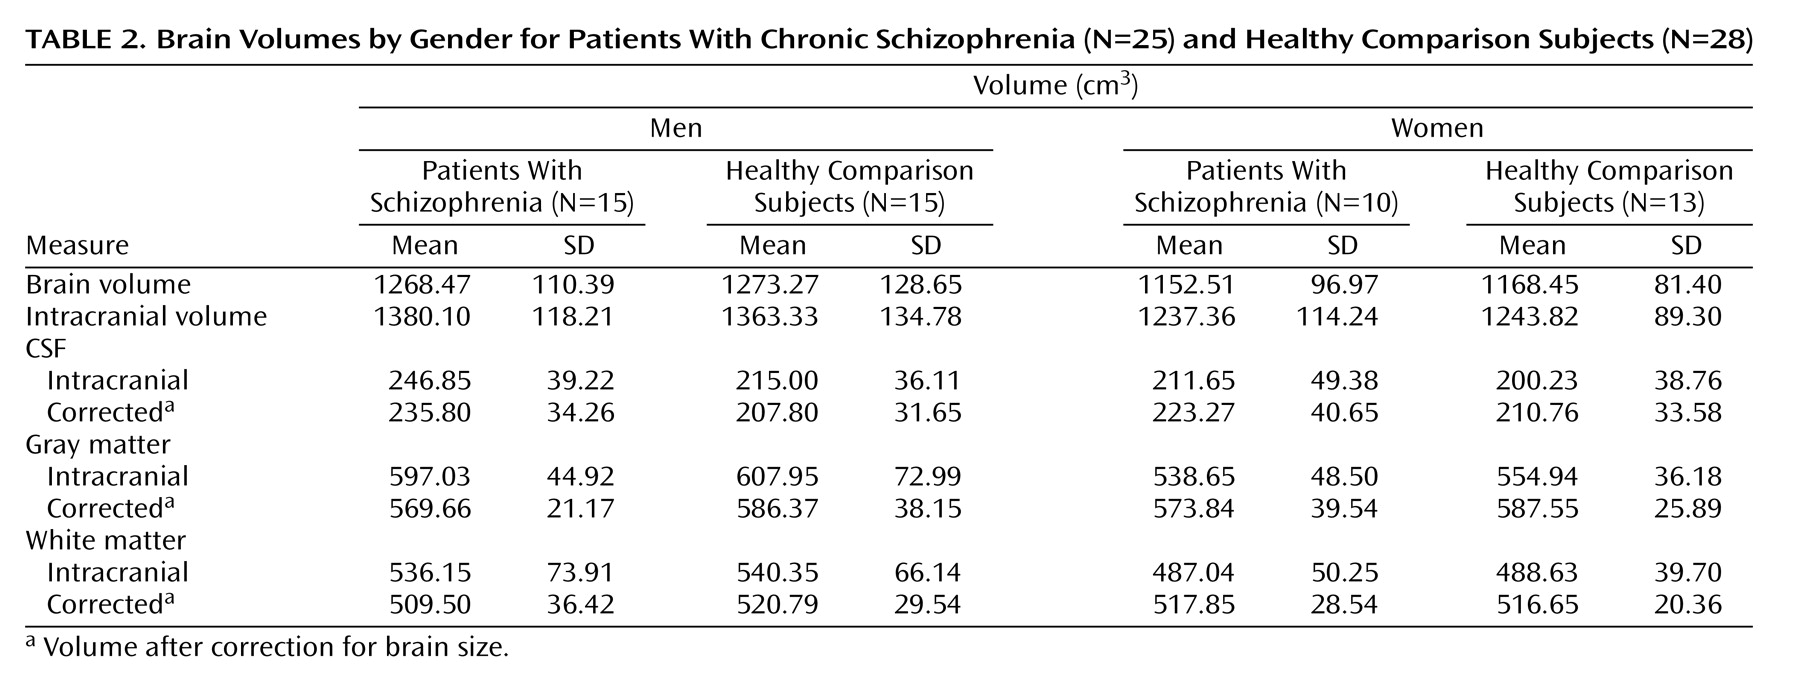
Table 2 shows intracranial, whole brain, and intracranial tissue and CSF volumes (cm
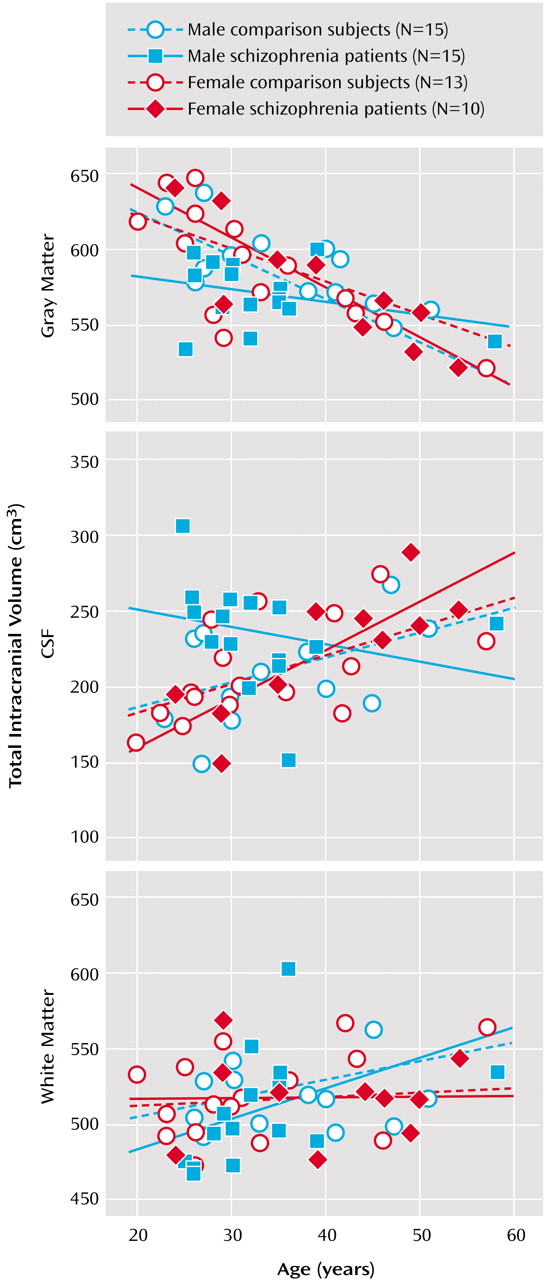
3), before and after correction for brain size, in groups defined by sex and diagnosis. Main effects of sex (larger volumes in male subjects) were observed for intracranial volume (F=5.49, df=1, 45, p<0.02) and whole brain volume (F=10.85, df=1, 45, p<0.002), with no other significant effects noted. Gray matter volumes showed significant main effects of age (F=50.09, df=1, 45, p<0.0001), a sex-by-diagnostic group interaction (F=5.17, df=1, 45, p<0.02), and a three-way interaction between diagnosis, sex, and age (F=4.13, df=1, 45, p<0.04).
Figure 3 shows a decrease in gray matter with age, although male schizophrenia patients possess smaller gray matter volumes even in young adulthood. A complementary pattern of results was observed for intracranial CSF volumes for which significant age (F=9.03, df=1, 45, p<0.004), diagnosis-by-sex (F=5.94, df=1, 45, p<0.01), sex-by-age (F=5.98, df=1, 45, p<0.01), and diagnosis-by-sex-by-age (F=4.68, df=1, 45, p<0.03) effects were detected.
Figure 3 also shows that male schizophrenia patients exhibited CSF volumes similar to those of older comparison subjects and female patients. White matter volumes showed significant increases with age (F=4.81, df=1, 45, p<0.03) (
Figure 3).
Subarachnoid CSF and Cortical Gray Matter Principal-Component Analysis Scores
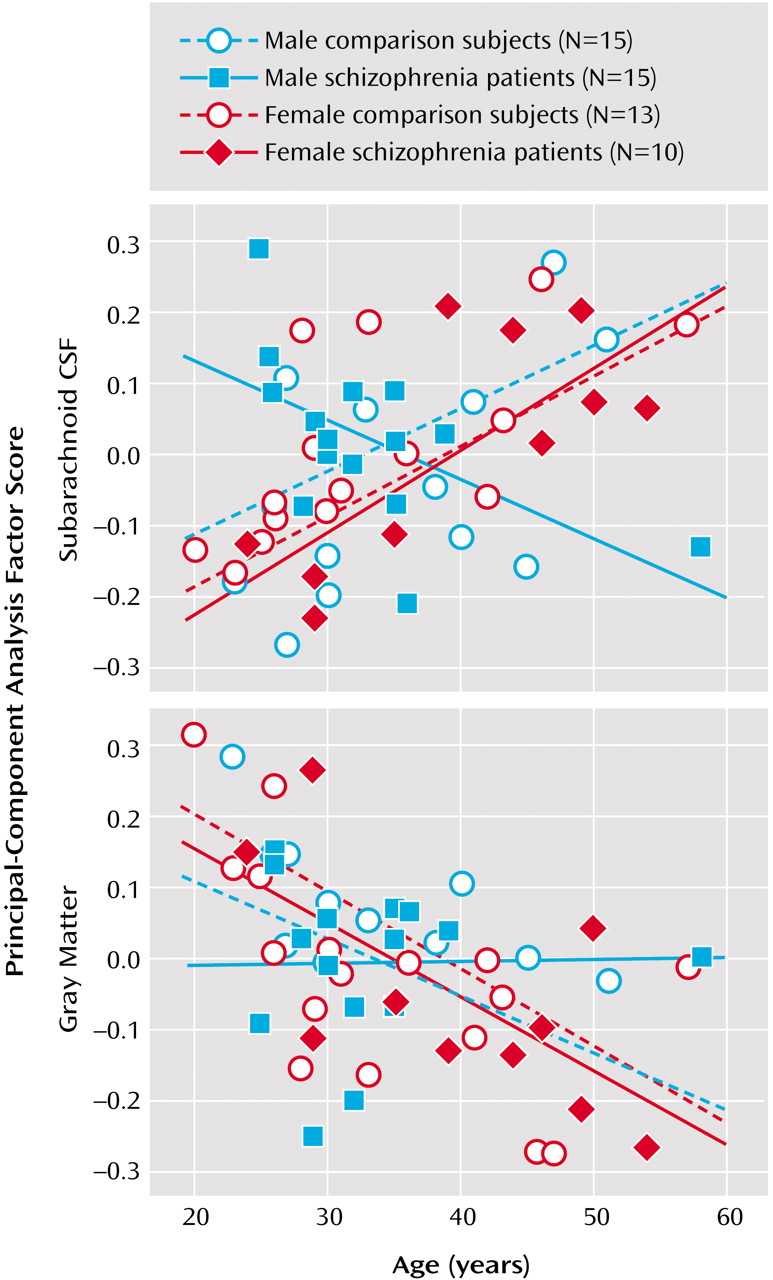
Subarachnoid CSF factor scores from the first principal-component analysis showed significant main effects of diagnosis (F=3.97, df=1, 45, p<0.05), age (F=9.36, df=1, 45, p<0.003), and sex (F=10.81, df=1, 45, p<0.002). Significant interaction effects were also observed for diagnostic group and age (F=4.82, df=1, 45, p<0.03), diagnostic group and sex (F=8.98, df=1, 45, p<0.01), sex and age (F=8.98, df=1, 45, p<0.004), and diagnostic group, sex, and age (F=7.15, df=1, 45, p<0.01).
Figure 4 shows greater sulcal and subarachnoid CSF scores in older subjects, although male patients exhibited larger subarachnoid CSF scores even in young adulthood.
First component cortical gray matter factor scores showed a main effect of age only (F=15.32, df=1, 45, p<0.0003). Since schizophrenia effects were absent, the same analyses were performed for principal-component analysis components accounting for a lesser percentage of the total variance but falling above the elbow of the Scree plot (
Figure 2). We did not observe any significant effects of diagnosis, age, or sex, or any two- or three-way interactions for any of the remaining six components analyzed individually or in combination, using repeated-measures analysis of variance.
Figure 4 plots raw cortical gray matter principal-component analysis scores from the first principal component.
Statistical Mapping of Subarachnoid CSF and Cortical Gray Matter Proportions
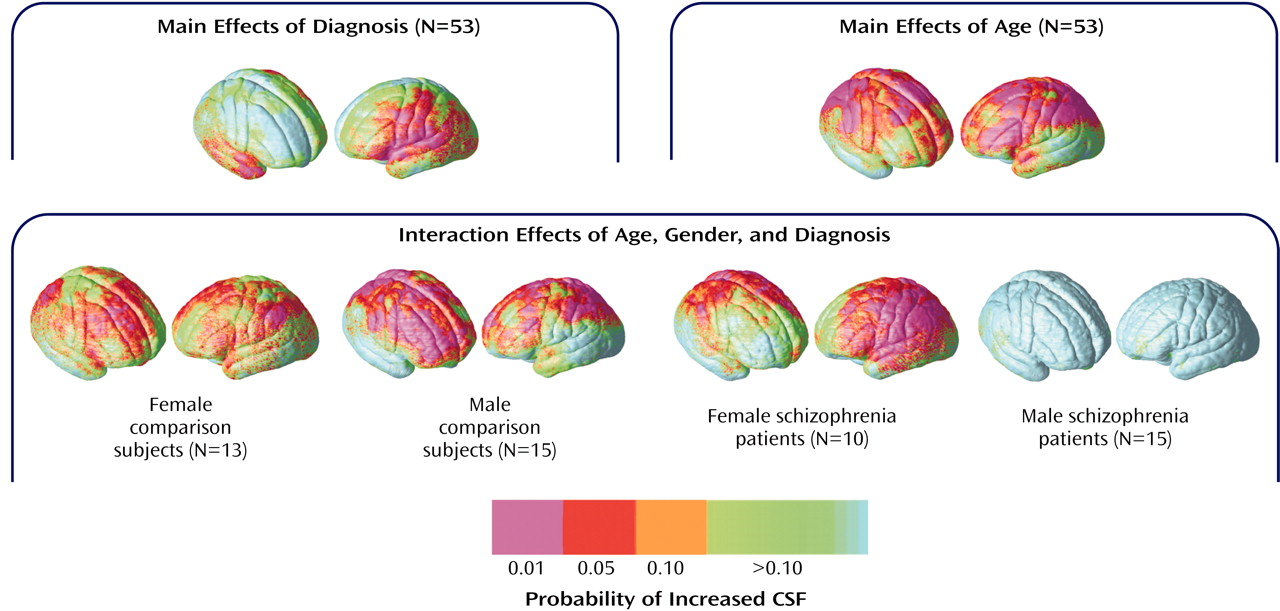
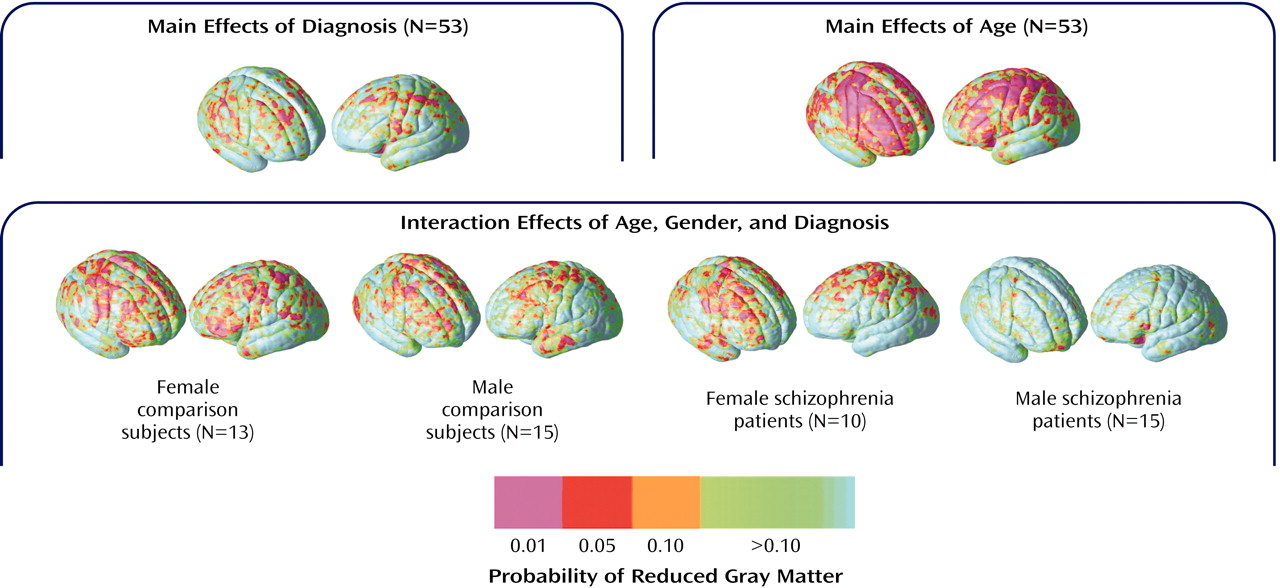
To isolate regional differences in subarachnoid CSF and cortical gray matter, we compared tissue proportion measures at each three-dimensional cortical surface location between diagnostic groups and in association with age. Simple effects of age were mapped within groups defined by diagnosis and sex to follow up the significant diagnosis-by-sex-by-age interaction observed for subarachnoid CSF principal-component analysis scores. Probability values, indexed in color, were mapped back onto a group-averaged cortical surface model at each three-dimensional point location.
Figure 5 shows regional subarachnoid CSF proportion increases 1) in schizophrenia patients relative to healthy subjects, 2) in association with age across all groups, and 3) in association with age in groups defined by sex and diagnosis. Significant left hemisphere CSF increases were present surrounding the superior temporal gyrus and perisylvian, inferior frontal, and parietal cortices in the schizophrenia patients. In the right hemisphere, significant subarachnoid CSF increases were pronounced surrounding the Sylvian fissure and anterior temporal lobe. Significant linear relationships between CSF increases and age were widely distributed surrounding dorsolateral prefrontal and parietal heteromodal association cortices. These effects were similar when simple effects of age were mapped within groups defined by sex and diagnosis. Male patients with schizophrenia, however, failed to exhibit significant regional CSF increases in association with age, as consistent with the principal-component analysis results.
Figure 6 shows the same probability maps for cortical gray matter proportion measurements. Significant regional gray matter reductions, mapped at each cortical surface location in three dimensions, appeared small and spatially diffuse in schizophrenia patients relative to healthy subjects, consistent with the principal-component analysis results. Linear reductions in cortical gray matter occurred in association with age in dorsolateral prefrontal and parietal association cortices. Simple effects for age showed similar although less pervasive regional gray matter reductions in association with age within each group. However, in spite of the negative three-way interaction for cortical gray matter principal-component analysis scores, male patients appeared to exhibit less regional gray matter reductions with age in comparison with the other groups.
Relationships Between Volumes and Principal-Component Analysis Scores
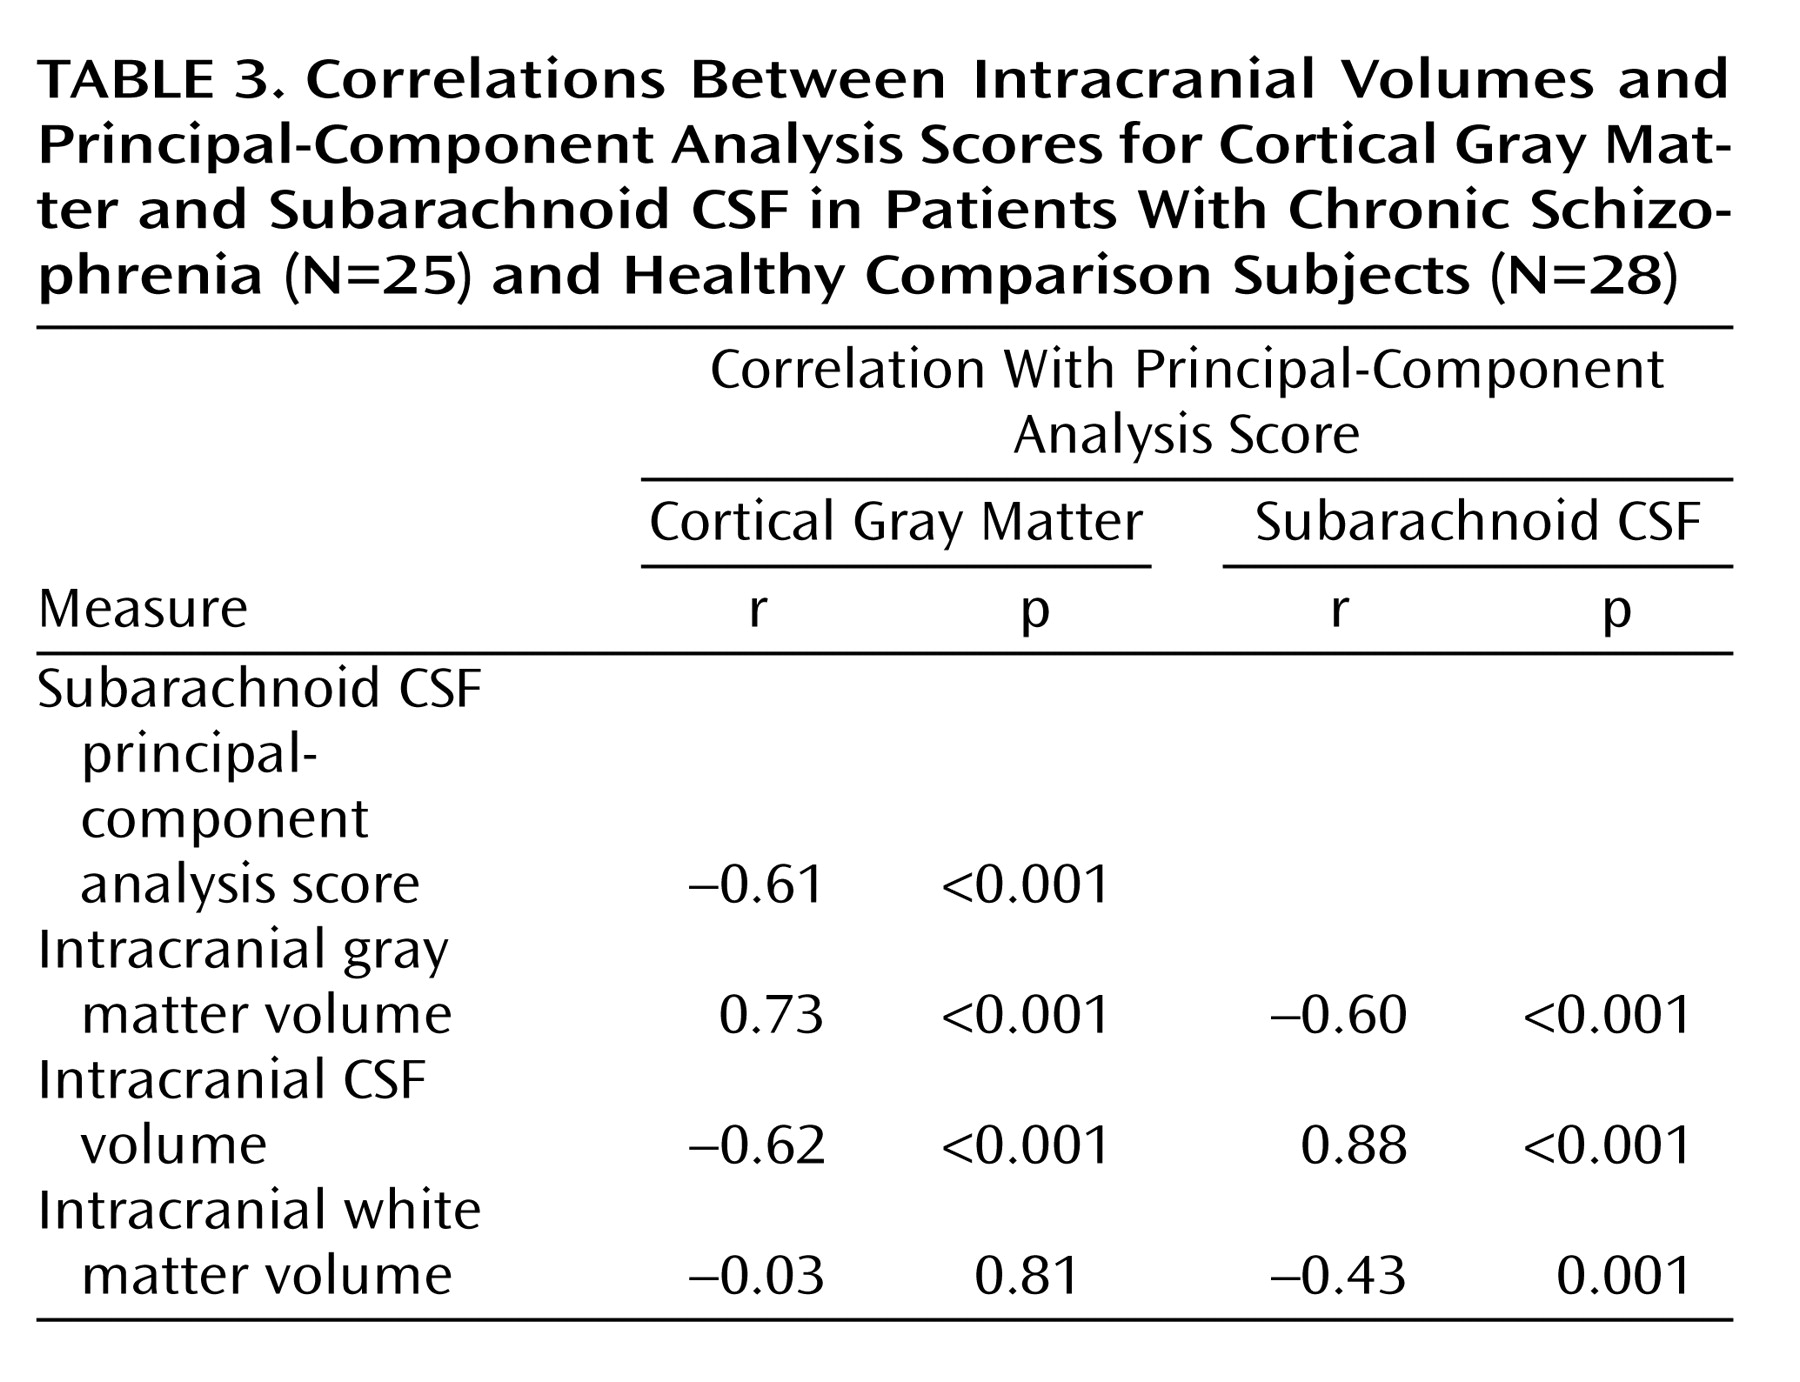
Table 3 lists Pearson’s correlation coefficients and probability values showing relationships between intracranial volumes and factor scores from the first principal components. Subarachnoid CSF and cortical gray matter factor scores were correlated with each other and with intracranial tissue volumes. Gray matter factor scores and overall white matter volumes failed to show significant associations.
Discussion
We aimed to confirm the regional specificity of cortical gray matter deficits in chronic schizophrenia and to establish whether sex and age, shown to influence brain tissue distributions in normal individuals
(23,
26,
57), interact with the disease processes contributing to these abnormalities. Reciprocal relationships between gray matter decreases and extracortical CSF increases are shown during normal aging
(26,
58,
59). Regional increases in extracortical CSF may thus also serve to predict where brain tissue is lost during disease and to determine whether normal aging effects are disturbed in schizophrenia. Although some previous reports suggest that increases in sulcal CSF are pronounced in temporal and frontal regions in schizophrenia
(6,
7,
60), no prior study has characterized regional CSF increases in the sulcal and subarachnoid space surrounding the entire cerebral cortex in patients with schizophrenia relative to healthy subjects. We therefore additionally examined effects of diagnosis, sex, and age for local extracortical CSF measures.
Results showed that schizophrenia patients exhibit significantly larger proportions of extracortical CSF relative to healthy subjects and that sex and age significantly interact with disease effects when CSF measures are reduced using principal components analysis. In spite of strong negative associations between gray matter and subarachnoid CSF factor scores from the first components of the principal-components analysis (
Table 3), only main effects of age were observed for first component gray matter scores. Scree plots, however, emphasize that the dimensionality of variance influencing cortical gray matter reductions is higher than the dimensionality of variance contributing to CSF increases (
Figure 2). Since the first component for cortical gray matter accounted for only 21.5% of the total variance and failed to reveal significant schizophrenia effects, we analyzed the six components remaining above the elbow of the Scree plot. These components also failed to show significant schizophrenia effects for cortical gray matter. Results suggest, therefore, that while possibly still present, schizophrenia effects and interactions between diagnosis, age, and sex are lost among a multitude of other effects that alter global patterns of gray matter concentration. Such effects could include clinical symptoms
(61), cognitive deficits
(62), medications, a family history of schizophrenia
(63), or other unknown genetic or environmental insults. Unfortunately, it was either not possible or not pragmatic to dissociate the contributing effects of these variables given the relatively small size of our study groups.
Regional Increases in Subarachnoid CSF
To identify local increases in subarachnoid and sulcal CSF in schizophrenia and the modulating effects of sex and age, we compared local CSF to brain tissue ratios at thousands of homologous points surrounding the cortical surface between individuals. Schizophrenia-related CSF increases were observed surrounding perisylvian cortices, including bilateral superior temporal gyrus, and were more widely distributed in the left hemisphere. Extracortical CSF increases observed in association with advancing age were pronounced surrounding frontal and parietal association cortices, as consistent with established findings
(23,
26,
57). Female schizophrenia patients showed aging effects similar to healthy subjects. Male patients, however, exhibited increased CSF even in young adulthood. Only longitudinal follow-up studies, however, can confirm that age-related increases in CSF are disturbed in male patients. Both principal-component analyses and statistical mapping results, however, make clear that age and biological sex are important predictors of extracortical CSF enlargements in schizophrenia.
Regional Cortical Gray Matter Deficits
MRI studies employing volumetric methods have shown gray matter deficits in almost all cortical regions in schizophrenia, although reductions in temporal cortices, and to a lesser extent, in subregions of the parietal and frontal lobes, are most replicated
(3,
10,
16,
21,
64). Similarly, gray matter deficits in the orbitofrontal
(20,
63) and medial frontal cortices
(19,
20,
61,
65) as well as the superior temporal gyrus and the temporal poles
(19,
20,
61) have been identified by using voxel-based morphometry, although coordinate locations have varied between studies. In our study, gray matter deficits were not significant when measures were reduced using principal-component analysis. When gray matter proportion comparisons were made at each cortical location, however, some small and spatially diffuse cortical gray matter reductions were observed in frontal and parietal association cortices and within the right posterior superior temporal gyrus (
Figure 6). These results may conflict with previous schizophrenia studies observing focal gray matter deficits in the superior temporal gyrus
(3).
In the same study groups, we previously measured cortical gray matter volumes in discrete lobar regions using manual delineation procedures
(56). Only marginal reductions in cortical gray matter volumes were observed in the temporal lobes (p<0.08, two-tailed) in schizophrenia, results that are not inconsistent with our current findings. However, in a more refined region of interest study, we found significant hippocampal volume reductions, again in the same schizophrenia study group
(48), as in line with most prior reports
(3,
17). Differences between manual delineation results and those obtained in this study are likely attributable to sampling radius chosen for measuring local tissue proportions within the cortical mantle. That is, gray matter measurements from the most medial parts of the temporal lobes, including the hippocampus proper and gray matter voxels from beds of deep cortical fissures, fell outside of the 15-mm measurement radius used for gray matter sampling (
Figure 1). Likewise, differences in subcortical gray matter and surrounding the medial surface of the brain as well as the deep surfaces of the insula were not examined in our investigation in which tissue proportions were compared only within the cortical mantle.
Also in contrast with our findings, Cannon et al.
(39) reported highly significant gray matter deficits in large and partially nonoverlapping areas of prefrontal and temporal heteromodal association cortices in schizophrenia probands and their unaffected co-twins relative to healthy subjects, using the same general methodological approach as employed in our study. Image preprocessing steps, however, were different in this prior investigation. Specifically, image volumes were not scalp-edited before obtaining gray matter proportion measures at each cortical location. Increases in extracortical CSF and “gray” matter voxels from nonbrain tissue in unedited MR volumes may largely influence local tissue proportion measurements obtained from each individual (
Figure 1). This has been demonstrated previously where cortical gray results appear to more closely reflect extracortical CSF changes in unedited MR volumes
(56).
Intracranial Tissue Volumes
As universally reported in the normative literature, male subjects possessed significantly larger brain volumes than did female subjects, although sex effects were absent for intracranial tissue volumes after brain size correction. Also confirming established reports, linear decreases in gray matter and complementary increases in CSF volume were observed during normal aging, and intracranial white matter volumes increased with age
(23,
26,
57,
59,
65,
66). Significant interactions between diagnostic group, sex, and age were present for intracranial gray matter and CSF volumes with effects similar to those observed for subarachnoid CSF principal-component analysis scores. Results again suggested the presence of premature aging processes in male schizophrenia patients. These results are compatible with observations of accelerated gray matter losses within 2–4 years following disease onset
(36,
37,
67,
68). Although results from a large cross-sectional study spanning five decades suggest that steeper aging effects occur in older patients with schizophrenia
(37), the age range of our study groups prevented cross-sectional investigation of such effects.
Our results are consistent with the majority of studies in the published literature that show small, although often nonsignificant, reductions in whole brain volume in schizophrenia patients relative to healthy subjects (3,
10,
11,
22). However, with the inclusion of subarachnoid CSF, intracranial volumes were marginally increased in male patients relative to healthy subjects. These results are consistent with prior studies, where increases, or decreases less pronounced than for brain volumes only, are reported for intracranial volumes in schizophrenia patients compared with healthy subjects
(10). Moreover, when CSF to whole brain ratios (or CSF to gray matter ratios) are compared, disease effects are invariably larger than for whole brain volumes or gray matter volumes alone
(6,
9,
33).
In normal development, intracranial size appears driven by brain volume expansion until adolescence, when brain growth peaks, with gray matter growth peaking slightly earlier
(58). After adolescence, intracranial size stabilizes, although extracortical CSF increases as whole brain volume and gray matter decline. In our study, schizophrenia-related gray matter deficits were of lesser magnitude than extracortical CSF increases. Extracortical CSF increases, therefore, although significantly correlated with gray matter reductions, appeared not completely at the expense of gray matter loss. Similarly, increases in CSF in patients could not be attributed to changes in white matter volumes that increased with age and showed no diagnostic group effects. It may be possible, however, that patients possess an excess of gray matter early in development that decreases over time to just below the normal threshold, therefore accounting for the larger extracortical CSF increases observed later in development in schizophrenia patients relative to healthy subjects. Of interest is that gray matter increases have been reported in childhood-onset schizophrenia patients, although these increases appear to decrease rapidly over time
(40,
69). Gray matter increases in early-onset schizophrenia patients have been observed in temporal lobe regions, the same regions showing regional subarachnoid CSF increases in our study.
Methodological Considerations
Although manual delineation measurements are still considered the gold standard for obtaining reliable regions of interest measures
(70), computerized brain mapping methods may offer improved spatial sensitivity for localizing small differences in tissue distributions between groups. That is, global as well as local differences in cortical and subcortical tissue can be examined simultaneously with these methods
(71). Moreover, individual differences in brain size, shape, and tissue distributions may be taken into account. For example, voxel-based morphometry methods allow voxel-wise comparisons to be made throughout the entire brain volume after registering and transforming tissue-classified MR data into a standard stereotaxic space
(19,
72). Like voxel-based morphometry, our methodological approach utilizes registration of MR data, requires tissue classification, applies smoothing procedures, and provides results in the form of statistical maps. In contrast to voxel-based morphometry, which requires the underlying automated registration method to be imprecise in order to generate a measurable signal
(73), our computational cortical matching methods are able to align the surface anatomy as precisely as posible using manually delineated features without compromising the resulting signal. The reliance on manual delineation should be advantageous to the extent that automated registration methods may fail to correctly identify pertinent homologies but may also be disadvantageous to the extent that the results are susceptible to human error
(71).
Tissue measurements obtained after using cortical pattern-matching algorithms, however, are constrained by the size of the sphere used to sample local tissue proportions at the same spatial locations between individuals. In this study, we chose a 15-mm kernel size to increase signal to noise for local tissue measurements
(30,
54,
74,
75). We also chose this kernel size because it captures all voxels within the subarachnoid space, so regional differences in extracortical CSF can be compared between groups. Validations between tissue proportion measurements using this kernel size and manual delineation procedures have been shown previously. Specifically, Sowell et al.
(54) demonstrated that when the manually delineated region of interest is small and at the same cortical surface location, measures of gray matter concentration and gray matter volume are similar.
Conclusions
Although significantly correlated, increases in sulcal and subarachnoid CSF appear a more robust neuroanatomical correlate of schizophrenia than reductions in cortical gray matter. Increased extracortical CSF in the absence of significant brain size or gray matter reductions may implicate disturbed developmental processes resulting from an initial increase in brain tissue, particularly in temporal lobe regions, although this hypothesis remains to be confirmed in follow-up investigations. Overall, patients with chronic schizophrenia showed only small and spatially diffuse regional reductions in cortical gray matter compared with healthy subjects, although regionally specific sulcal and subarachnoid CSF increases were observed that were strongly influenced by biological sex and age. If CSF occupies the intracranial space where tissue is lost, brain tissue (gray matter or white matter) may be lost prematurely in male patients. Only longitudinal studies, however, may confirm disturbed aging effects in male patients. Finally, small effect sizes observed in earlier investigations
(10,
11) may further indicate that the power to detect local gray matter deficits between diagnostic groups requires larger sample sizes or that other factors in addition to sex and age contribute to cortical gray matter deficits in schizophrenia.

