Schizophrenia is a severe psychiatric disorder characterized by psychotic and cognitive symptoms, and it is a leading cause of global disease burden (
1). It is generally preceded by a prodromal phase of attenuated psychotic symptoms and functional impairment (
2). Individuals meeting standardized criteria for this phase have an ultra high risk for developing a psychotic disorder, in most cases schizophrenia (
3). Approximately 35% of high-risk persons will develop a psychotic disorder within 24 months (
4).
While the pathoetiology of schizophrenia is not fully understood, there is increasing evidence for the involvement of neuroinflammatory processes. Microglia are the resident immune cells of the CNS, and several lines of evidence indicate microglial involvement in the pathology of psychosis (
5–
7). In ultra-high-risk individuals, there are elevations in the levels of proinflammatory cytokines (
8), which are also elevated in patients with schizophrenia (
9). The levels of such peripheral markers have also been associated with reductions in gray matter volume in both ultra-high-risk individuals (
10) and patients with schizophrenia (
11). Postmortem investigation of brain tissue has found elevated microglial cell density (with a hypertrophic morphology) in persons with schizophrenia compared with control subjects (
5), particularly in the frontal and temporal lobes (
12), although some studies have found no differences (
13). However, since microglial activity is dynamic, postmortem studies may miss alterations early in the development of the disease.
Elevations in microglial activity can be measured in vivo with positron emission tomography (PET) using radioligands specific for the 18kD translocator-protein (TSPO), which is expressed on microglia (
14). Investigations using the first-generation radiotracer (R)-[
11C]PK11195 have revealed an increase in TSPO binding in medicated patients with schizophrenia when compared with healthy control subjects (
6,
7). The first investigation of microglia using PET in schizophrenia, in a cohort of 10 patients, revealed a total gray matter elevation of microglial activity in the 5 years following diagnosis (
6). The most recent investigation in seven chronically medicated patients with schizophrenia using (R)-[
11C]PK11195 demonstrated an elevation in hippocampal binding potential and a nonsignificant 30% increase in total gray matter binding potential (
7).
While these studies indicate elevated microglial activity in schizophrenia, they included patients in whom the disorder was already established. It is therefore unknown whether this elevation predates the onset of, or becomes evident after, the first episode of frank psychosis.
Therefore, in the present investigation, we sought to determine whether microglial activity was elevated in ultra-high-risk individuals using the novel TSPO radioligand [
11C]PBR28. Our a priori hypothesis was that microglial activity would be elevated in the total gray matter in ultra-high-risk individuals relative to matched comparison subjects. An additional prediction was that this elevation would be evident in frontal and temporal cortical regions, brain areas that have been particularly implicated in ultra-high-risk pathophysiology (
15). [
11C]PBR28 is a second-generation TSPO tracer with a higher affinity for TSPO than (R)-[
11C]PK11195 (
16). Recent in situ binding evidence shows that a genetic polymorphism (a C/T substitution at rs6971) influences the binding of TSPO tracers, including [
11C]PBR28. This results in three TSPO binding profiles: high-affinity binders (C/C) have the greatest tracer affinity; low-affinity binders (T/T) have a 50-fold reduction in affinity; and mixed-affinity binders (C/T) express both high-affinity binder and low-affinity binder TSPO in approximately equal proportion (
17). In view of this, we included a cohort of patients to test the hypothesis that TSPO binding is elevated in schizophrenia after adjusting for this polymorphism, since this has not been taken into account previously. We also tested the secondary hypothesis that there would be a positive relationship between total gray matter microglial activity and symptom severity.
Method
The study was approved by the local research ethics committee and was conducted in accordance with the Declaration of Helsinki. After complete description of the study to the subjects, written informed consent was obtained.
Participants
A total of 56 individuals were recruited and completed the study. Fourteen participants who met ultra-high-risk criteria, as assessed on the Comprehensive Assessment of the At-Risk Mental States (
2), were recruited from OASIS (Outreach and Support in South London) (
18) (mean age=24.3 years [SD=5.40]; male:female ratio=7:7). Fourteen age-matched (SD=5 years) comparison subjects were recruited through newspaper and poster advertisements. Fourteen persons with schizophrenia (mean age=47.0 years [SD=9.31]; male:female ratio=11:3) were recruited from mental health centers in London (South London and Maudsley NHS Foundation Trust). An additional 14 age-matched (SD=5 years) healthy subjects were recruited for comparison with this second cohort (
Table 1).
All participants met the following inclusion criteria: 1) aged ≥18 years, 2) no significant physical or psychiatric health contraindications on assessment and medical examination by a trained physician.
Subjects were then screened based on the following exclusion criteria:
1.
Exposure to any medications, including anti-inflammatory medications, in the last 1 month (see the data supplement accompanying the online version of this article).
2.
History of substance abuse/dependence as determined by the Structured Clinical Interview for DSM-IV Axis I Disorders, Clinician Version (SCID-CV) (
19).
3.
Benzodiazepine use, whether prescribed or not (
20). One subject was excluded due to a positive result for benzodiazepines on the scan day.
4.
History of head injury resulting in unconsciousness, or any physical medical condition associated with inflammation.
5.
At the time of screening, participants were tested for TSPO genotype to determine binding status (
17). Those with a low-affinity binder genotype were excluded.
6.
In ultra-high-risk individuals and comparison subjects: antipsychotic medication exposure.
7.
Significant prior exposure to radiation.
8.
Pregnancy or breast feeding.
Healthy comparison subjects with a personal history of a psychiatric disorder or a first-degree relative with schizophrenia or a psychotic illness were excluded.
Clinical Measures
At screening, all participants were assessed using SCID-CV (
19). Ultra-high-risk individuals were assessed with the Comprehensive Assessment of the At-Risk Mental States (
2) by a trained investigator, and patients with a diagnosis of schizophrenia were assessed with the Positive and Negative Syndrome Scale (PANSS) (
21) by a clinician on the day of the PET scan. Depressive symptoms were assessed using the Beck Depression Inventory (BDI) (
22).
PET Imaging
An initial low-dose transmission CT scan (0.34 mSv) was acquired for attenuation and scatter correction using a Siemens Biograph TruePoint PET/CT scanner (Siemens Medical Solutions, Erlangen, Germany). Participants then received a bolus injection of [11C]PBR28 (mean Mbq activity=325.31 [SD=27.03]) followed by a 90-minute emission scan. PET data were coregistered with whole-brain structural images acquired with a 3T MRI scanner (Trio, Siemens Medical Solutions, Erlangen, Germany). A 32-channel coil was used for all but one scan, where a 12-channel coil was used instead.
PET Acquisition
PET data were acquired dynamically over a 90-minute time window and binned into 26 frames (durations: 8×15 seconds, 3×1 minute, 5×2 minutes, 5×5 minutes, 5×10 minutes). Images were reconstructed using filtered back projection, which provides better data quality and signal-to-noise ratio over iterative methods (
23), and corrected for attenuation and scatter. During the PET acquisition, arterial blood data were sampled via the radial artery using a combined automatic-manual approach. A continuous (one sample per second) sampling system (Allogg ABSS, Mariefred, Sweden) measured whole-blood activity for the first 15 minutes of each scan (see the online
data supplement).
Structural MRI
Each subject underwent a T1 weighted MRI brain scan. MRI images were used for gray/white matter segmentation and region of interest (ROI) definition. A neuroanatomical atlas (
24) was coregistered on each subject’s MRI scan and PET image using a combination of Statistical Parametric Mapping 8 (
http://www.fil.ion.ucl.ac.uk/spm) and FSL (
http://fsl.fmrib.ox.ac.uk/fsl/fsl-4.1.9/) functions, implemented in MIAKAT (
http://www.imanova.co.uk). The primary region of interest was total gray matter. Secondary regions of interest were temporal and frontal lobe gray matter (
12).
Image Analysis
All PET images were corrected for head movement using nonattenuation-corrected images, since they include greater scalp signal, which improves realignment compared with attenuation-corrected images (
25). Frames were realigned to a single “reference” space identified by the individual T
1-weighted MRI scan. The transformation parameters were then applied to the corresponding attenuation-corrected PET frames, creating a movement-corrected dynamic image for analysis. Regional time-activity curves were obtained by sampling the image with the coregistered atlas. Hence quantification of [
11C]PBR28 tissue distribution was performed using the two-tissue compartmental model accounting for endothelial vascular TSPO binding (2TCM-1K) (
26), since this has been shown to have improved performance compared with the two-tissue compartmental model not accounting for endothelial binding (2TCM) (
26). Nevertheless, for completeness, we analyzed the data using the 2TCM as well (see Table S1 in the online
data supplement). Even after accounting for genotype, high intersubject variability is seen in imaging with TSPO tracers. With PK11195, plasma protein binding is evident and may account for some levels of variability with TSPO imaging (
27). Indeed, TSPO ligand quantification approaches mostly use tissue reference methodologies (
28). Analysis of PK11195 is conducted using simplified reference tissue models and supervised cluster analysis (
29). This method is not applicable to second-generation TSPO tracers, including PBR28, since the higher ligand affinity leads to appreciable endothelial binding in the blood brain barrier (
26). As a result, it is not possible to identify a supervised cluster for reference. Our outcome measure therefore was the distribution volume ratio (the ratio of the V
T [volume of distribution] in the region of interest to V
T in the whole brain) because this accounts for intersubject variability in the input function. In the secondary analyses, we tested the regional specificity of group changes by comparing distribution volume ratio between groups in regions (the cerebellum and brainstem) where we did not expect marked inflammatory changes based on the postmortem studies and gray matter changes seen in people at risk of psychosis (
30). To test for nonspecific effects of normalization, our parameters used to normalize the PET signal were tested for group differences. There are no differences in blood input function or V
T in normalization regions used (see Table S2 in the online
data supplement).
Statistical Analysis
Data, other than for gender and genotype, were shown to have a normal distribution following a Shapiro-Wilk test (
31). Hence parametric tests were implemented for all but gender and affinity analyses, where a Mann-Whitney U test was used. Demographic data and tracer activity data were analyzed using independent-samples t tests. Multiple analysis of covariance with Bonferroni correction (
32) was used to determine whether there was an effect of group on [
11C]PBR28 binding associated microglial activity in the total gray matter, frontal lobe, and temporal lobe. There are data to suggest that cortical microglial density, hence TSPO binding, is elevated with aging (
33), which is also evident in our data (see Table S3 in the
data supplement). For this reason, we performed group-level analysis using age as a covariate. There is a significantly higher binding of tracer in high-affinity binders than mixed-affinity binders, and the variation in signal from high-affinity binder and mixed-affinity binder subjects is high, with a large degree of overlap across the binding statuses (see Figure S3 in the
data supplement). Hence we pooled the binding statuses in our groups and covaried for genotype in our analysis (
17). For all statistical comparisons, alpha was set at a 0.05 threshold (two-tailed) for significance. Statistical analysis was performed using SPSS 21 (IBM, Armonk, N.Y.). Partial correlation analysis was used to test the association of microglial activity with symptom severity and total gray matter volumes, with age and affinity as covariates of no interest.
Results
Demographic Comparisons and Tracer Dosing
No significant demographic differences between the two groups of comparison subjects and respective patient groups were observed (
Table 1). There were no differences in the injected dose, injected mass, specific activity, parent plasma fraction, or plasma over blood ratio between ultra-high-risk individuals or patients with schizophrenia and their respective comparison subjects (see Table S4 in the
data supplement).
[11C]PBR28 Distribution in Total Gray Matter Regions
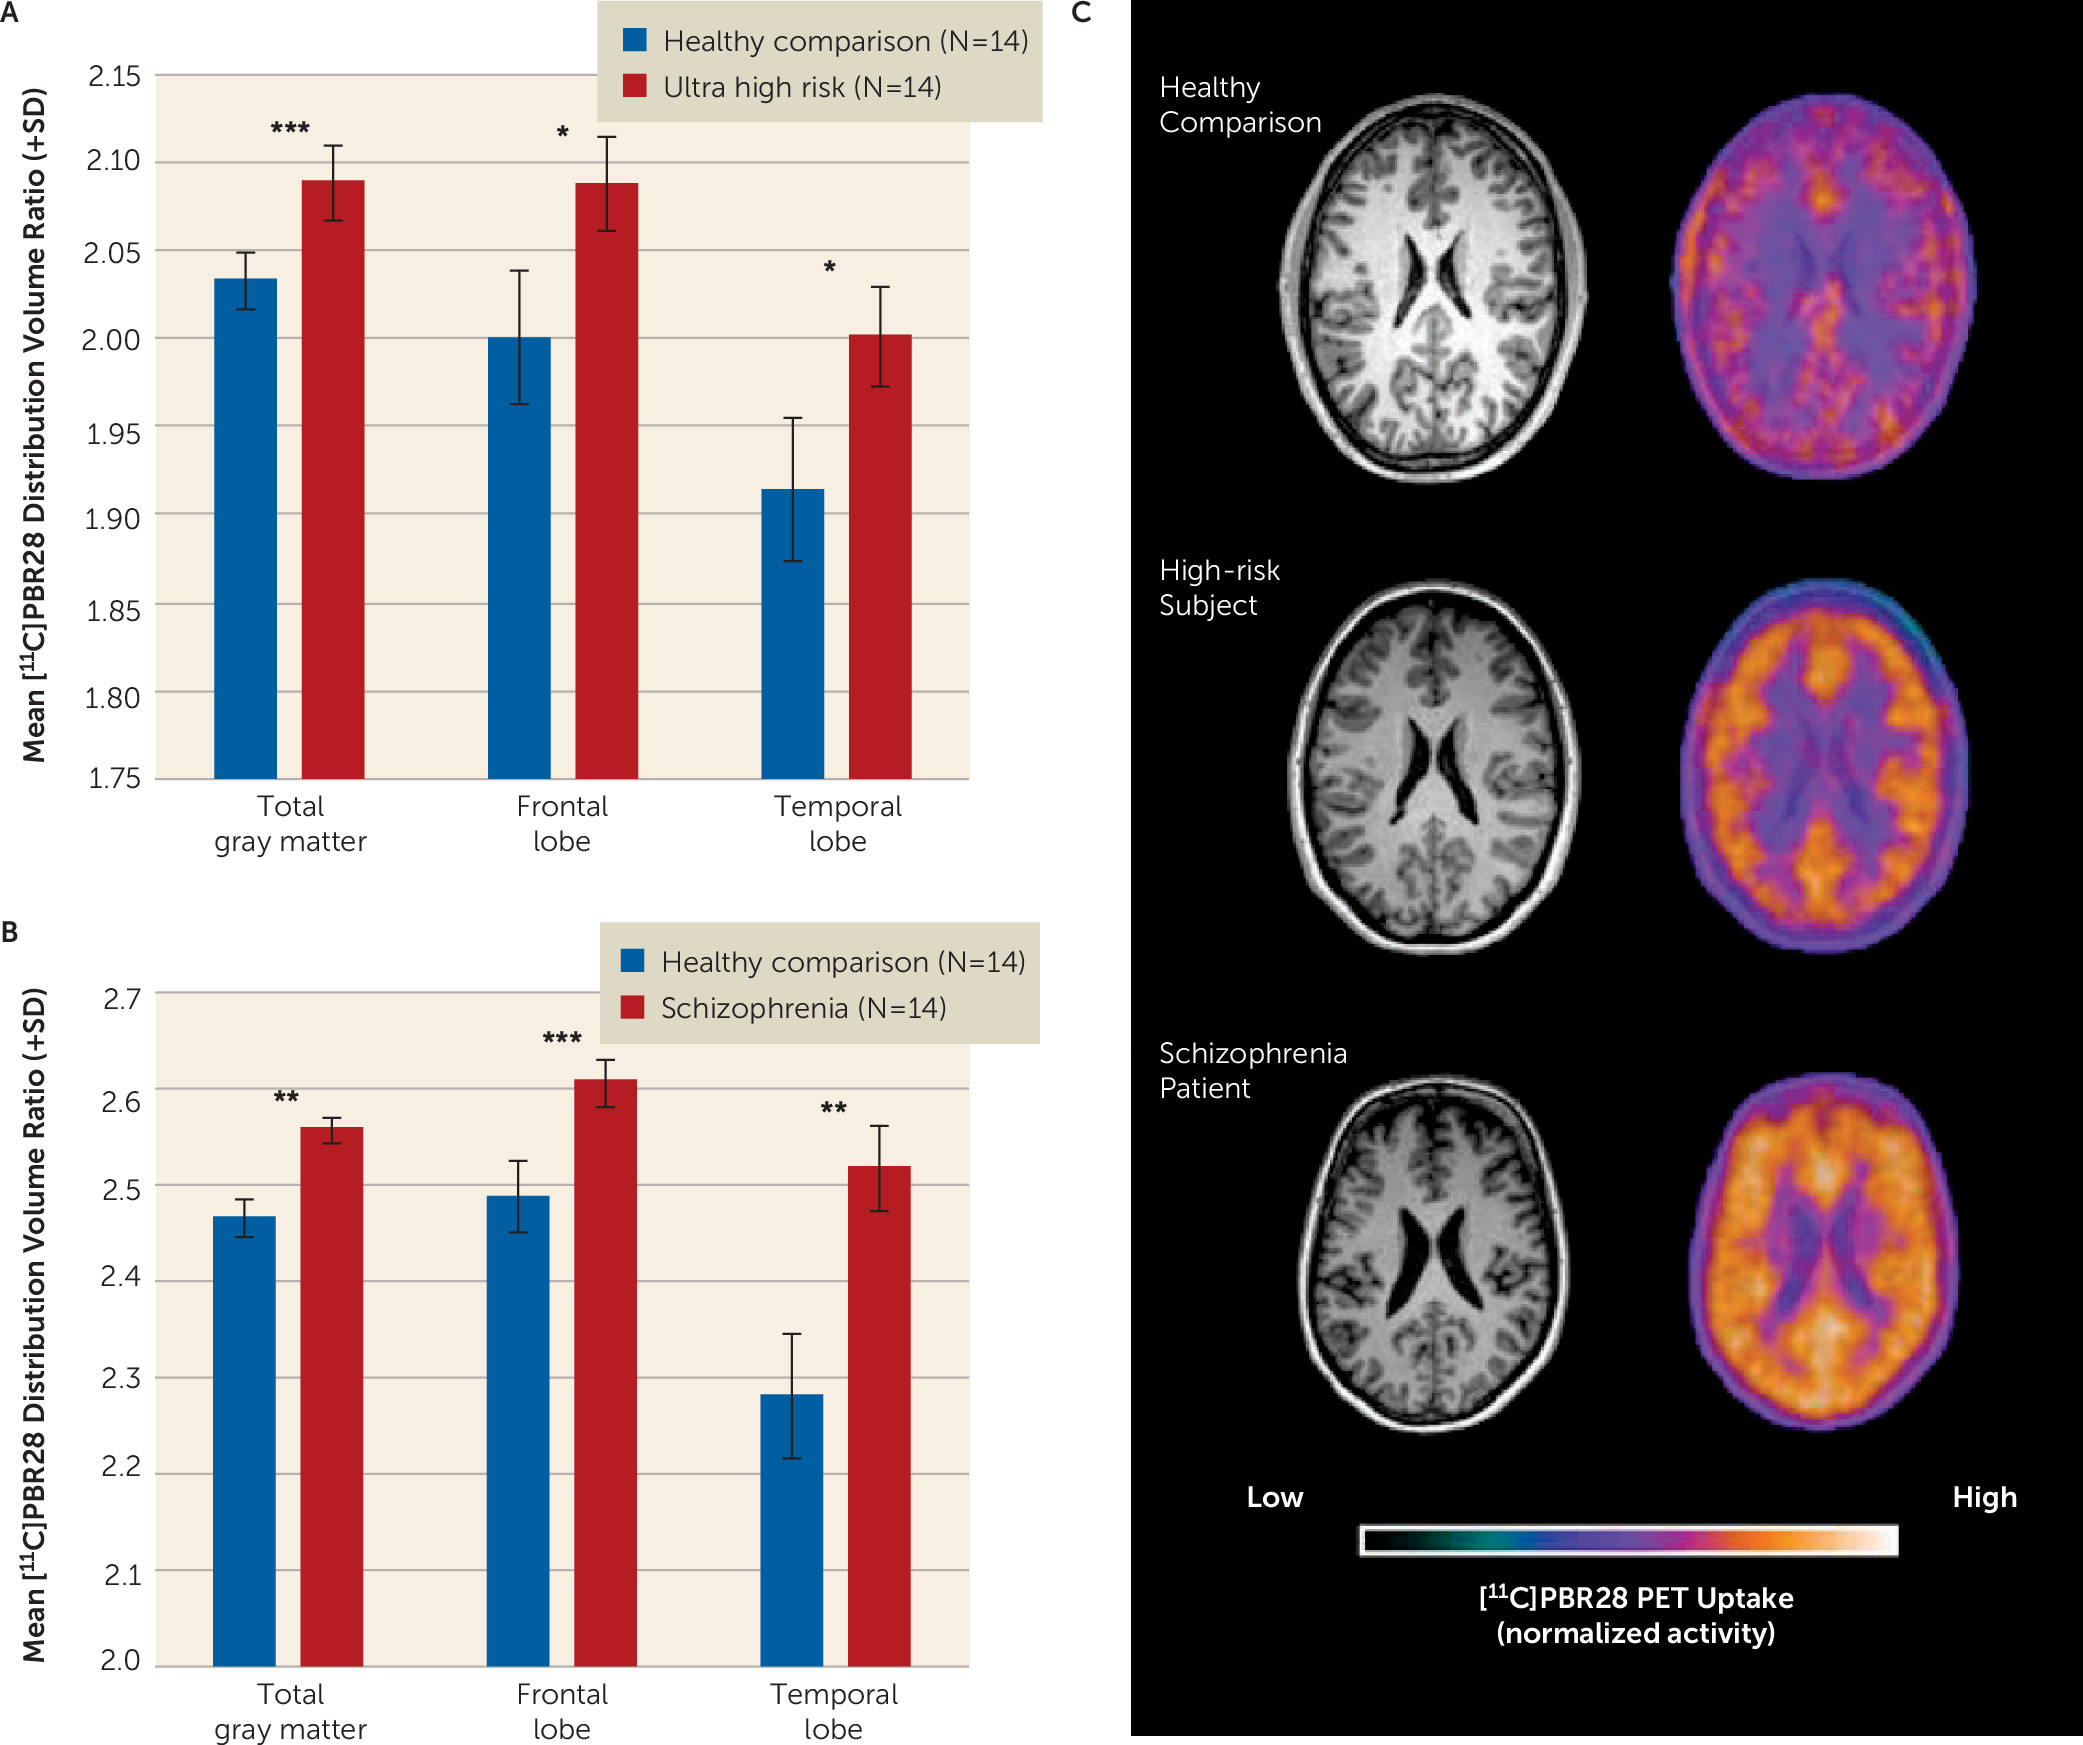
The [
11C]PBR28 distribution volume ratios in total gray matter and frontal lobe and temporal lobe gray matter were significantly increased in ultra-high-risk individuals when compared with matched comparison subjects (
Table 2,
Figure 1A). Similarly, patients with a diagnosis of schizophrenia had elevated [
11C]PBR28 distribution volume ratios in total, frontal lobe, and temporal lobe gray matter compared with matched comparison subjects (
Table 2,
Figure 1B). Secondary analysis to investigate regional specificity revealed no difference between ultra-high-risk individuals or schizophrenia patients and respective comparison subjects in cerebellar or brainstem distribution volume ratio (
Table 2). Representative PET images of comparison subjects, ultra-high-risk individuals, and patients with schizophrenia are presented in
Figure 1C. When comparing regions using V
T, with either 2TCM or 2TCM-1K, no significant group difference was observed (see Table S5 in the
data supplement).
Two subjects in the ultra-high-risk group had taken citalopram in the past. However, only one was using the medication at the time of the scan, and no other ultra-high-risk participants had taken psychotropic drugs. Reanalysis excluding the two subjects who had taken citalopram did not alter the significant elevation in the [11C]PBR28 distribution volume ratio in the high-risk group in the total (F=6.601, df=22, 3, p=0.018) and frontal lobe (F=5.392, df=22, 3, p=0.030) gray matter, but the finding in the temporal cortex was no longer significant (p=0.149).
Genotype-specific analysis.
In further sensitivity analyses, we repeated the analyses separately for high-affinity binders and mixed-affinity binders in the ultra-high-risk group. This showed that the elevation in the ultra-high-risk individuals was present irrespective of whether the analysis was restricted to high-affinity binders or mixed-affinity binders (see Table S6 and Figure S3 in the data supplement).
Relationship Between [11C]PBR28 Distribution and Symptom Severity
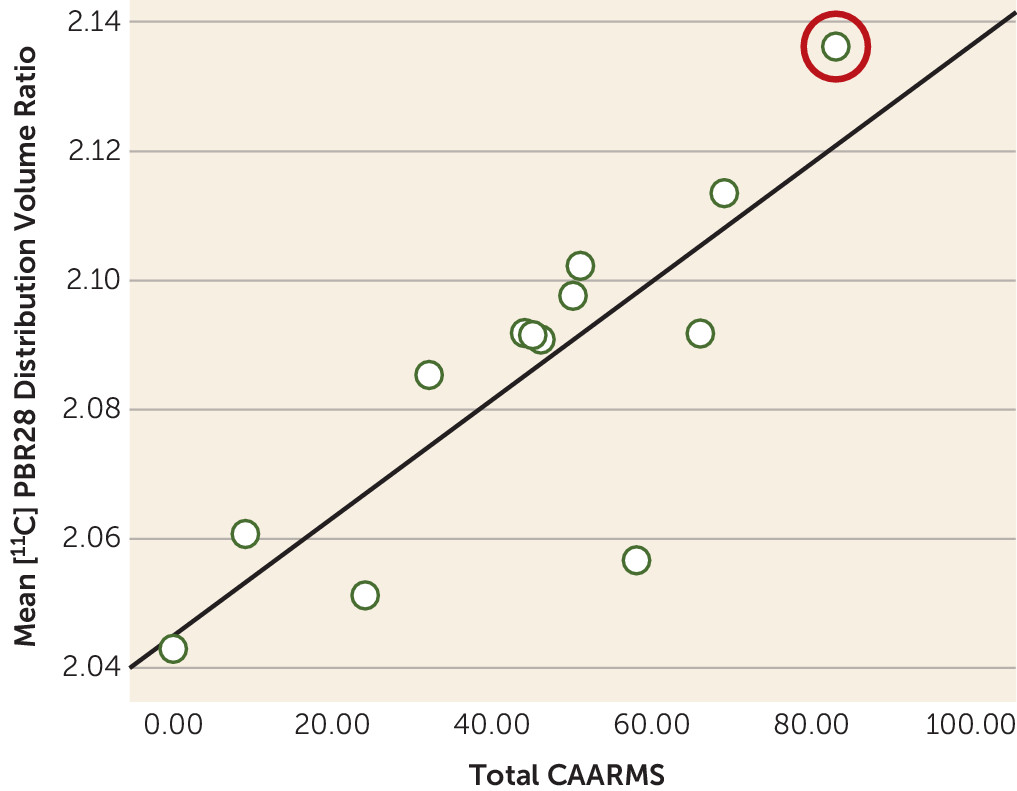
In ultra-high-risk participants, there was a positive correlation between the total Comprehensive Assessment of the At-Risk Mental States symptom severity score and [
11C]PBR28 distribution volume ratio in total gray matter (r=0.730, p=0.011) (
Figure 2). No correlation was observed between [
11C]PBR28 distribution volume ratio in total gray matter and duration of ultra-high-risk symptoms (r=−0.086, p=0.802). In patients with schizophrenia, there was no significant correlation between total gray matter distribution volume ratio and total PANSS score (see Figure S2 in the
data supplement). There was no relationship between depressive symptom severity (Beck Depression Inventory score) and total gray matter distribution volume ratio in either patients with schizophrenia (r=0.478, p=0.162) or ultra-high-risk participants (r=−0.339, p=0.506).
Exploratory analysis of distribution volume ratio normalization.
To evaluate whether our findings were influenced by the signal used for normalization, we conducted exploratory analyses using the cerebellum and white matter as alternative normalization regions. Cerebellar normalization did not alter the major regional findings (frontal lobe: p=0.001; temporal lobe: p=0.006). White matter normalization performed similarly to the cerebellum (see Table S7 in the data supplement).
Discussion
Our main finding is that [11C]PBR28 binding ratio, a marker of microglial activity, is elevated in people at ultra high risk of psychosis, with a large effect size (Cohen’s d >1.2). Furthermore, [11C]PBR28 binding ratio was associated with the severity of symptoms in ultra-high-risk individuals, linking elevated microglial activity to the expression of subclinical psychotic symptoms. Importantly, we found no relationship with depressive symptoms, suggesting elevated microglial activity is specific to the development of psychotic-like symptoms, rather than psychiatric symptoms in general. It would be valuable to examine change in [11C]PBR28 signal during the course of the prodromal period to determine whether there is a change during the prodromal phase. Because the ultra-high-risk group, who had recently presented to psychiatric services, was medication naive and had no history of psychotic disorder, these findings cannot be attributed to effects of previous illness or its treatment. Interestingly, at the time of this writing, one ultra-high-risk participant transitioned to first-episode psychosis. This participant had the highest total gray matter [11C]PBR28 signal in the cohort (distribution volume ratio=2.14). Follow-up of the remaining participants is required to determine the role of elevated TSPO availability in the onset of psychosis.
The present findings are consistent with recent evidence of elevated peripheral inflammatory markers in people at high risk of psychosis (
8,
10) and suggest that elevated microglial activity predates the onset of frank psychosis. We also found evidence of elevated microglia activity in people with schizophrenia relative to comparison subjects, with a large effect size (Cohen’s d >1.7). This extends previous PET studies that have not controlled for TSPO genotype (
34), a potential confound because genotype influences binding, by showing that TSPO binding is elevated after controlling for TSPO genotype. Our findings are also consistent with the findings of a postmortem study in schizophrenia, which also used PBR28. However, because it was in vitro, a two-point assay was used to quantify specific PBR28 binding to show elevated PBR28 binding in schizophrenia (
35). We did not find the same symptom correlation in schizophrenia patients as we did in ultra-high-risk individuals. This may be due to the fact that these patients were not acutely unwell.
Limitations
Antipsychotic treatment is a potential confound in the schizophrenia group (see Table S6 in the online
data supplement) but not the ultra-high-risk group. There is growing evidence to suggest an influence of antipsychotic medication on microglial cell dynamics, including evidence that antipsychotics may reduce microglial activity (
36–
38). Hence, in future studies it would be preferable to investigate patients with schizophrenia who are medication naive.
In the present investigation, we have used an approach to analysis (accounting for endothelial and vascular binding) that has been shown to be more reliable than alternative approaches (
26). This was applied in a standardized automated manner across groups and also applied to control regions (brain stem and cerebellum) to examine the specificity for our findings. A limitation of all current approaches to imaging microglia, including with [
11C]PBR28, is that the outcome measure is V
T. Thus, the elevation in gray matter could reflect increased nonspecific tracer binding as well as biological signal. However, blocking studies have shown that a substantial proportion of V
T for [
11C]PBR28 is specific binding to the TSPO (
39), although the proportion in schizophrenia remains to be determined.
In our sample, plasma input analysis resulted in an approximate 30% level of V
T variability using the 2TCM approach. This variability is due in part to a small free fraction (
fp), which has been reported to introduce 29% variability (see Table S8 in the
data supplement [also see reference
26]). This being the case, the noise and measurement error from
fp appears to be greater than the component it represents (
40) and obscures the signal difference in our cohorts. Indeed, the variability of
fp in our cohorts reaches 35% (9.9 [SD=3.5]), resulting in a large V
T variability. Further work is needed to assess the full consequences of
fp variability. Our normalization approach does, however, remove individual variation in
fp, thus reducing intersubject variability.
We used the distribution volume ratio, in this case with whole-brain signal as the normalization region, as our outcome measure. We also showed that the main findings remained significant when other regions were used, suggesting that the findings are robust to the method of normalization. The use of distribution volume ratio analysis is a standard approach in PET imaging that has recently been applied to second-generation TSPO tracers (
41,
42), including using whole-brain normalization (
43), as well as to the first-generation TSPO tracer PK11195 (
44,
45). Preclinical studies have demonstrated that the distribution volume ratio approach is able to detect microglial changes due to inflammatory stimuli and have confirmed that elevated distribution volume ratio signal corresponds to elevated levels of TSPO and other markers of microglia measured ex vivo using immunohistochemistry and/or autoradiography (
46–
49). These preclinical studies thus indicate the functional significance of elevated [
11C]PBR28 distribution volume ratio and support further in vivo investigation in patients to confirm the functional significance.
Normalization by the whole-brain VT raises a conceptual issue because the whole-brain VT includes the gray matter VT as one constituent. The whole-brain VT also includes the VT in other tissue compartments, including white matter and subcortical structures. Thus, the elevation we see in the ultra-high-risk and schizophrenia groups could indicate a reduced VT in one or more of these other compartments. Further work to investigate changes in these compartments, for example, using selective TSPO blockers, is required to test this interpretation.
The normalization approach would likely account for global group differences in nonspecific binding, but we cannot exclude a gray matter selective increase in nonspecific binding contributing to the elevations seen. While the signal-to-noise ratio of [11C]PBR28 PET imaging is better relative to first-generation tracers, it remains relatively low. However, this noise would obscure a difference between groups and thus is unlikely to account for our findings. In this study, we did not correct for possible partial volume effects. Given that brain volume is generally reduced in schizophrenia, these would tend to underestimate the elevations observed here and not account for our group differences. There is a relatively higher binding in comparison subjects matched to patients with schizophrenia over those matched to the ultra-high-risk group. This can be explained in part by age-associated increases in TSPO but also by an increased number of mixed-affinity binders in the ultra-high-risk matched comparison subjects. Finally, it is important to note that not all the ultra-high-risk participants will go on to develop a psychotic disorder, and we will conduct clinical follow-up to determine whether the elevated microglial activity is specific to the development of the disorder or risk factors for psychosis.
Implications
While TSPO may be expressed on astrocytes (
49) and some neuronal subtypes (
50), it is predominantly expressed on microglia (
51). The direct biological relationship between microglia and TSPO binding in vivo is not fully understood. However, in nonhuman primates inflammation-induced increases in microglial activity cause marked increases in [
11C]PBR28 signal, confirmed postmortem to be largely a result of microglial binding (
52). Microglia perform immune surveillance roles, mount inflammatory response to injury (
53), and are involved in synaptic modulation in experience-dependent plasticity (
54). Interpretation of elevated activity is therefore complex and not defined by “activated” or “resting” states. The elevations presented here might reflect a protective response triggered by associated pathology, such as glutamatergic excitotoxicity (
55), or indicate a primary neuroinflammatory process linked to risk factors for psychosis and the development of subclinical symptoms. When our findings are interpreted with evidence that anti-inflammatory drugs are effective in schizophrenia (
56), particularly in addressing early negative symptoms (
57), they suggest that a neuroinflammatory process is involved in the development of psychotic disorders. While this indicates that anti-inflammatory treatment may be effective in preventing the onset of the disorder, further studies are required to determine the clinical significance of elevated microglial activity.
Conclusions
Here we provide, to our knowledge, the first evidence of elevated brain microglial activity in people at ultra high risk of psychosis and show that greater microglial activity is associated with greater symptom severity. We also demonstrate the first in vivo elevations of TSPO binding in schizophrenia with a second-generation tracer after adjusting for TSPO genotyping. These findings are consistent with increasing evidence that there is a neuroinflammatory component in the development of psychotic disorders, raising the possibility that it plays a role in its pathogenesis.
Acknowledgments
The authors thank all the clinical imaging staff at Imanova for their assistance with this study, with particular thanks to Qi Guo for her initial input and assistance with positron emission tomography methodology.


