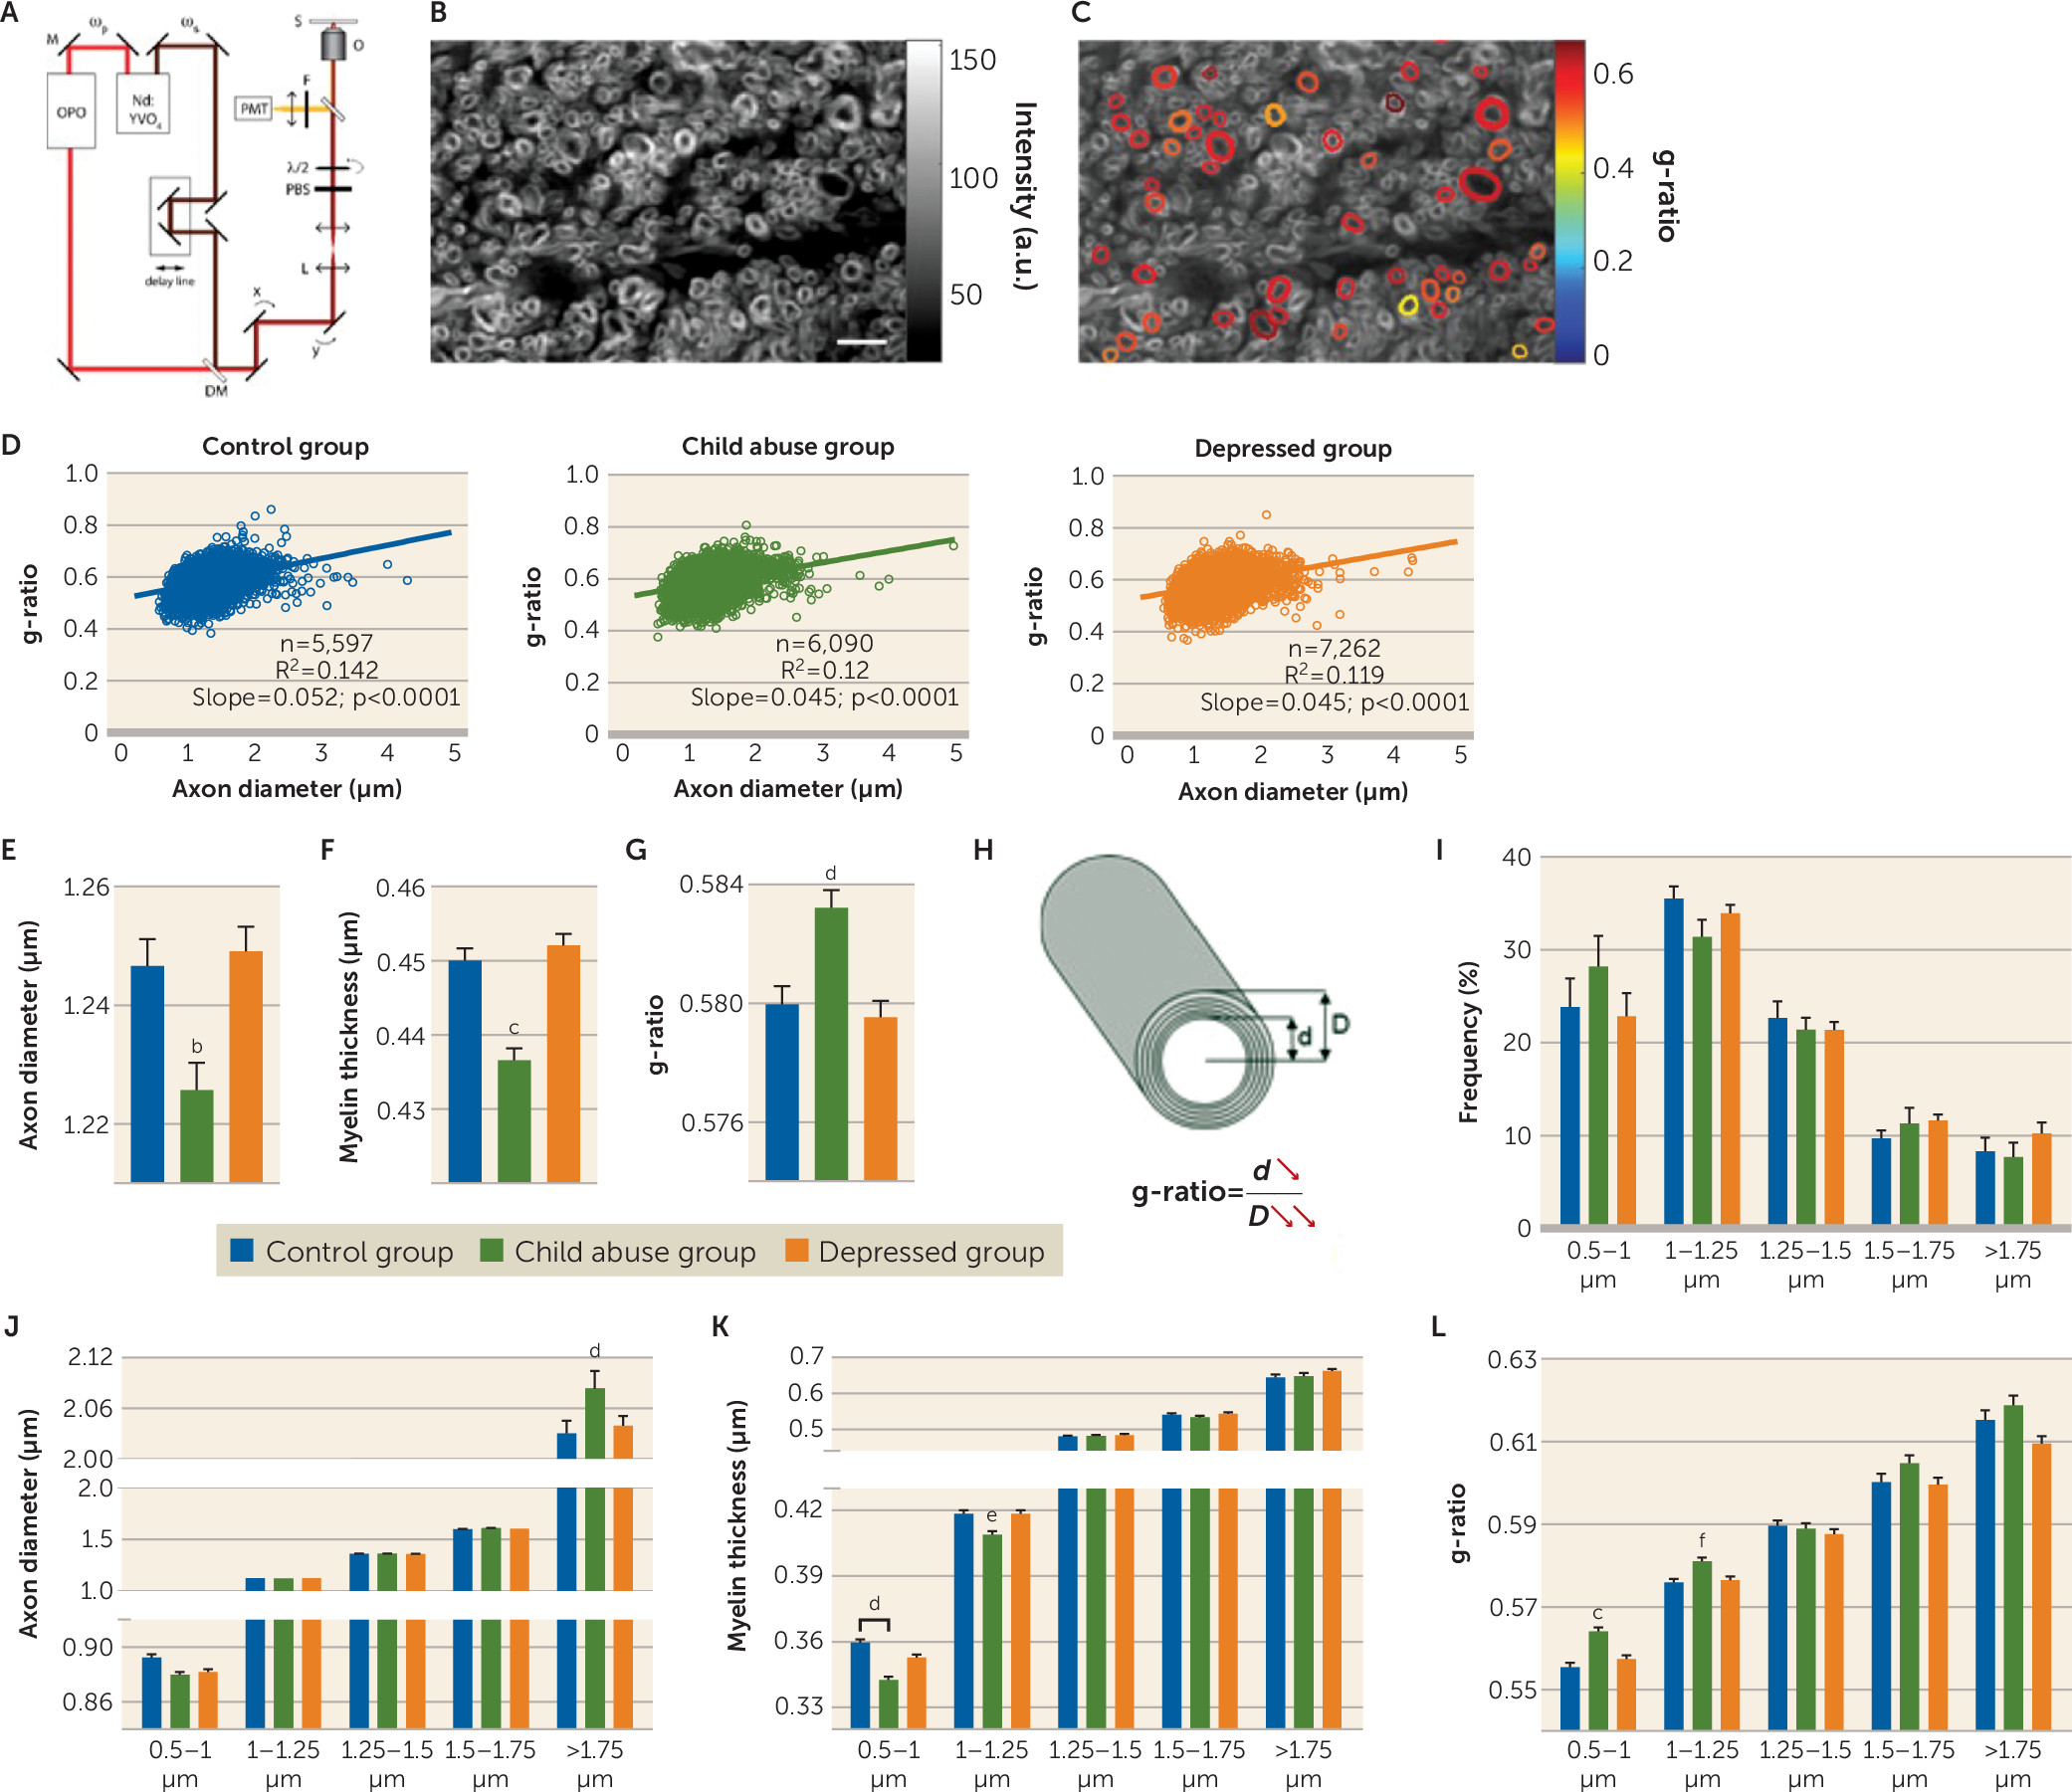
a Panel A is a schematic representation of the polarization-resolved coherent anti-Stokes Raman Scattering (CARS) setup. The fundamental Nd:YVO4 (brown) and OPO (red) signal-pulse trains are used as the Stokes ωs and pump ωp beams, respectively. The signal emitted from the sample (S) is collected in the epi direction (yellow). M=mirror; DM=dichroic mirror; L=lens; PBS=polarization beam splitter; λ/2=half-wave plate; O=objective lens; S=sample; F=anti-Stokes filter; PMT=photomultiplier tube. Panels B and C are images of myelinated fibers visualized by CARS microscopy before (panel B) and after (panel C) polarization-based segmentation. Myelin segments detected as oriented in the same plane (colored) are extracted for subsequent morphometric analysis. The scale bar is 8 μm. Panel D illustrates linear fits of g-ratio (defined as the ratio between the inner and outer diameters of the myelin sheath; see panel H) versus axon diameter of fibers detected by CARS of the control, child abuse, and depressed group. In panel E, the child abuse group showed an overall decrease in mean axonal diameter (one-way analysis of variance [ANOVA]: F=8.37, df=2, 18946, p<0.001; control group [N=5,597] versus child abuse group [N=6,090], p<0.01 by Tukey’s honest significant difference; control group versus depressed group [N=7,262], p>0.05). In panel F, axons are less myelinated in the child abuse group (one-way ANOVA: F=27.05, df=2, 18946, p<0.0001; control group versus child abuse group, p<0.0001 by Tukey’s honest significant difference; control group versus depressed group, p>0.05). In panel G, the mean g-ratio of cingulate cortex fibers is increased in the child abuse group (one-way ANOVA: F=11.68, df=2, 18946, p<0.0001; control group versus child abuse group, p<0.001 by Tukey’s honest significant difference; control group versus depressed group, p>0.05). These effects could not be attributed to differences in age or quality of postmortem tissue, as these parameters did not affect axon diameter, myelin thickness, or g-ratios (see Figure S13 in the online data supplement). Panel H is a schematic representation of the effects of child abuse on myelinated axon morphometry. The g-ratio of cingulate cortex fibers is increased in the child abuse group (panels G and H) as a consequence of decreased axon diameter (panel E) and, to a greater extent, decreased myelin thickness (panel F). Panel I shows the distribution of cingulate cortex fibers based on their axonal diameter. No difference between groups was found in the frequency of fibers per category (two-way ANOVA, group effect F=1.056e-012, df=2, 155, p>0.05; class effect: F=93.23, df=4, 155, p<0.0001; interaction: F=1.156, df=8, 155, p>0.05) or in the number of fibers imaged per category and subject (see Figure S11 in the data supplement). In panel J, larger-caliber fibers (>1.75 µm) from the cingulate cortex show increased axon diameter in the child abuse group (two-way ANOVA, class-by-group interaction: F=11.41, df=8, 18934, p<0.0001; for fibers >1.75 µm: control group versus child abuse group, p<0.001 by Tukey’s honest significant difference; control group versus depressed group, p>0.05). In panel K, small-caliber fibers (0.5–1 µm and 1–1.25 µm) are less myelinated in the child abuse group (two-way ANOVA, class-by-group interaction: F=2.904, df=8, 18934, p<0.01; 0.5- to 1-µm fibers: control group versus child abuse group, p<0.001; control group versus depressed group, p>0.05; 1- to 1.25-µm fibers: control group versus child abuse group, p<0.1; control group versus depressed group, p>0.1 by Tukey’s honest significant difference). In panel L, small-caliber fibers have a higher g-ratio in the child abuse group (F=2.305, df=8, 18934, p<0.05; 0.5- to 1-µm fibers: control group versus child abuse group, p<0.0001; control group versus depressed group, p>0.05; 1- to 1.25-µm fibers: control group versus child abuse group, p<0.05; control group versus depressed group, p>0.05 by Tukey’s honest significant difference). Finally, an increased molecular order of myelin was measured for all fibers, whatever their axonal diameter (see Figure S10 in the data supplement), which may reflect changes in the lipid composition and/or structural organization of myelin as a result of child abuse. Data in the bar graphs are presented as means, with error bars indicating standard error of the mean.
b Control versus child abuse group, Tukey’s honest significant difference, p<0.01.
c Control versus child abuse group, Tukey’s honest significant difference, p<0.0001.
d Control versus child abuse group, Tukey’s honest significant difference, p<0.001.
e Control versus child abuse group, Tukey’s honest significant difference, p<0.1.
fControl versus child abuse group, Tukey’s honest significant difference, p<0.05.
