Major depressive illness remains a leading worldwide contributor to disability despite the growing availability of medications and psychotherapies (
1). The persistent morbidity is partly due to the difficulty of treatment selection. An adequate “dose” of cognitive-behavioral therapy for depression is 10–12 weeks (
2). An antidepressant or augmentation medication trial requires at least 4 weeks at an adequate dosage (
2). Patients may spend months to years searching through options before responding to treatment (
3). Knowing sooner whether a treatment will be effective could increase the speed and possibly the rate of overall treatment response. The high potential value of treatment prediction biomarkers has spurred extensive research. Unfortunately, it has also encouraged commercial ventures that market predictive tests to both patients and physicians, often without the support of evidence of clinical efficacy (
4). Inappropriate use of invalid “predictive” tests could easily increase health care costs without benefiting patients (
5).
Electroencephalography (EEG) is a promising source of psychiatric biomarkers. Unlike serum chemistry or genetic variation, EEG directly measures brain activity. EEG is potentially more cost-effective than neuroimaging techniques, such as functional MRI (fMRI) and nuclear medicine computed tomography (PET/SPECT), which have also been proposed as biomarkers (
8–
10). EEG recordings can be more feasibly implemented in a wide variety of clinical settings, and it has essentially no safety concerns, whereas PET involves radiation and MRI cannot be used in the presence of metal foreign bodies.
Psychiatric biomarker studies have emphasized quantitative EEG, or QEEG (see the text box). Baseline and treatment-emergent biomarkers, as qualitatively reviewed in recent years (
11–
13), include simple measures such as loudness dependence of auditory evoked potentials (LDAEP) (
14–
22), oscillatory power in the theta and alpha ranges (see the text box) (
14,
23–
39), and the distribution of those low-frequency oscillations over the scalp (
35,
37,
40–
45). With the increasing power of modern computers, biomarkers involving multiple mathematical transformations of the EEG signal became available. These include a metric called
cordance (
23,
26,
46–
57) and a proprietary formulation termed the Antidepressant Treatment Response (ATR) index (
57–
61). Each is based on both serendipitous observations and physiologic hypotheses of depressive illness (
11,
12). LDAEP is believed to measure serotonergic function, oscillations are linked to top-down executive functions (
62,
63), and cordance may reflect cerebral perfusion changes related to fMRI signals. ATR and related multivariate markers (
64–
66) merge these lines of thought to increase predictive power. Recent studies (including the Canadian Biomarker Integration Network in Depression [CAN-BIND], the International Study to Predict Optimized Treatment–Depression [iSPOT-D], and the Establishing Moderators and Biosignatures of Antidepressant Response for Clinical Care study [EMBARC]) have sought to create large multicenter data sets that may allow more robust biomarker identification (
40,
67–
72).
Despite the rich literature, the value of QEEG as a treatment response predictor in depressive illness remains unclear. This is in part because there has been no recent meta-analysis aimed at the general psychiatrist or primary care practitioner. The last formal American Psychiatric Association position statement on EEG was issued in 1991 (
73), at which time personal computers had a fraction of the computing power of today’s computers. A 1997 American Academy of Neurology report (
74) focused on QEEG in epilepsy and traumatic brain injury. The most recent report, from the American Neuropsychiatric Association, was similarly cognition oriented (
75). All of these reports are over a decade old. More recent reviews have delved into the neurobiology of QEEG but have not quantitatively assessed its predictive power (
11–
13). The closest was a 2011 meta-analysis that combined imaging and EEG to assess the role of the rostral cingulate cortex in major depression (
76).
To fill this gap in clinical guidance, we performed a meta-analysis of QEEG as a predictor of treatment response in depression. We cast a broad net, considering all articles on adults with any type of major depressive episode, receiving any intervention, and with any study design or outcome scale. This approach broadly evaluated QEEG’s utility without being constrained to specific theories of depression or specific markers. We complemented that coarse-grained approach with a meta-regression investigating specific biomarkers to ensure that inconsistent results across the entire QEEG field would not mask a single effective marker.
Method
Our review focused on two primary questions: What is the overall evidence base for QEEG techniques in predicting response or nonresponse in the treatment of depressive episodes? Given recent concerns about reliability in neuroimaging (
10,
77), how well did published studies implement practices that support reproducibility and reliability?
We searched PubMed for articles related to EEG, major depression, and response prediction (see the
online supplement). We considered articles published in any indexed year. From these, we kept all that reported prediction of treatment response, to any treatment, in any type of depressive illness, using any EEG metric. Our prospective hypothesis was that EEG cannot reliably predict treatment response. We chose broad inclusion criteria to maximize the chance of a signal detection that falsified our hypothesis. That is, we sought to determine whether there is sufficient evidence to recommend the routine use of
any QEEG approach to inform psychiatric treatment. This is an important clinical question, given the commercial availability and promotion of psychiatric QEEG. We did not include studies that attempted to directly select patients’ medication based on an EEG evaluation, an approach sometimes termed “referenced EEG” (
78). Referenced EEG is not a diagnostic test, and as such does not permit the same form of meta-analysis.
The meta-analysis of diagnostic markers depends on 2×2 tables summarizing correct and incorrect responder and nonresponder predictions (
79). Two trained raters extracted these from each article, with discrepancies resolved by discussion and final arbitration by the first author. Where necessary, table values were imputed from other data provided in the article (see the
online supplement). For articles that examined more than one marker or treatment (
19,
29,
52,
57,
60,
67,
80), we considered them as separate studies. We reasoned that treatments with different mechanisms of action (e.g., repetitive transcranial magnetic stimulation [rTMS] versus medication) may have different effects on reported biomarkers, even if studied by a single investigator. For studies that reported more than one method of analyzing the same biomarker (
23,
34,
57), we used the predictor with the highest positive predictive value. This further increased the sensitivity and the chance of a positive meta-analytic result. Articles that did not report sufficient information to reconstruct a 2×2 table (
14,
15,
17,
21,
25,
28,
32,
33,
42,
43,
81–
92) were included in descriptive and study quality reporting but not in the main meta-analysis.
For quality reporting, we focused on whether the study used analytic methods that increase the reliability of conclusions. Chief among these is independent sample verification or cross-validation—reporting the algorithm’s predictive performance on a sample of patients separate from those originally used to develop it. Cross-validation has repeatedly been highlighted as essential in the development of a valid biomarker (
10,
11,
61,
74,
93). Our two other markers of study quality were total sample size and correction for multiple hypothesis testing. Small sample sizes falsely inflate effect sizes (
93), and correction for multiple testing is a foundation of good statistical practice.
We conducted univariate and bivariate meta-analyses using R’s
mada package for analysis and
metafor for visualizations (
94–
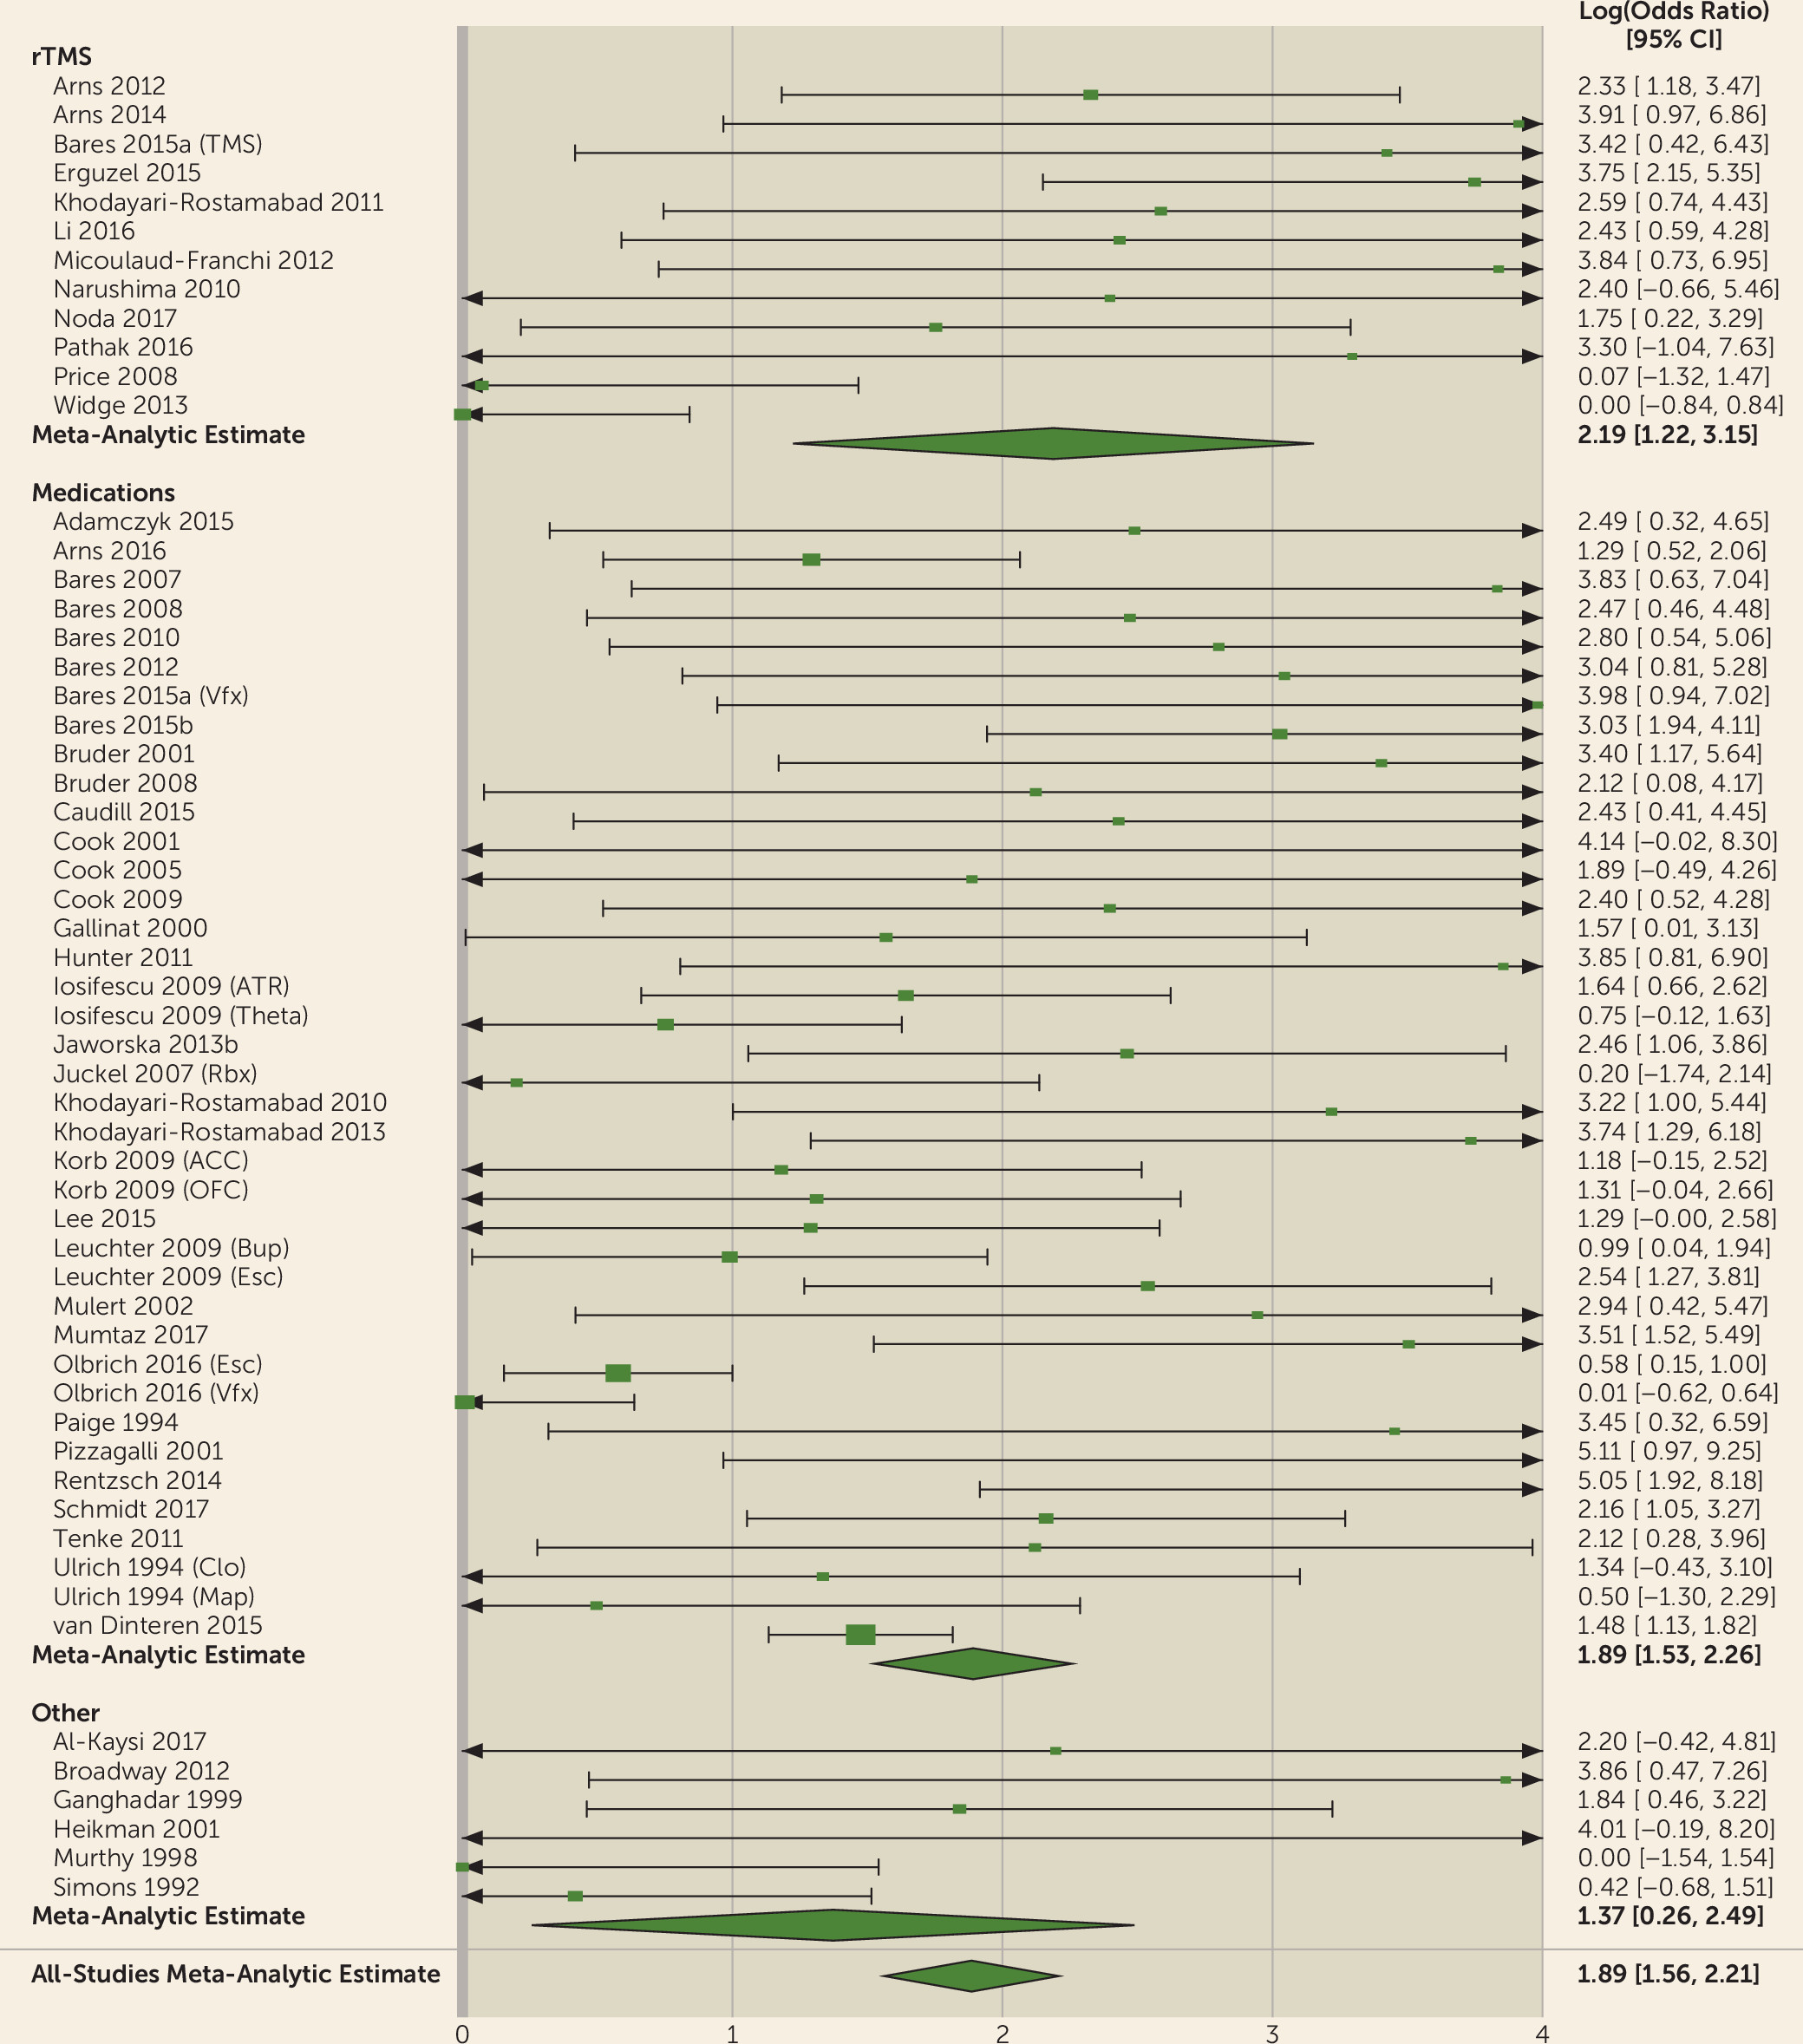
96). The univariate analysis summarized each study as the natural logarithm of its diagnostic odds ratio, using a random-effects estimator (
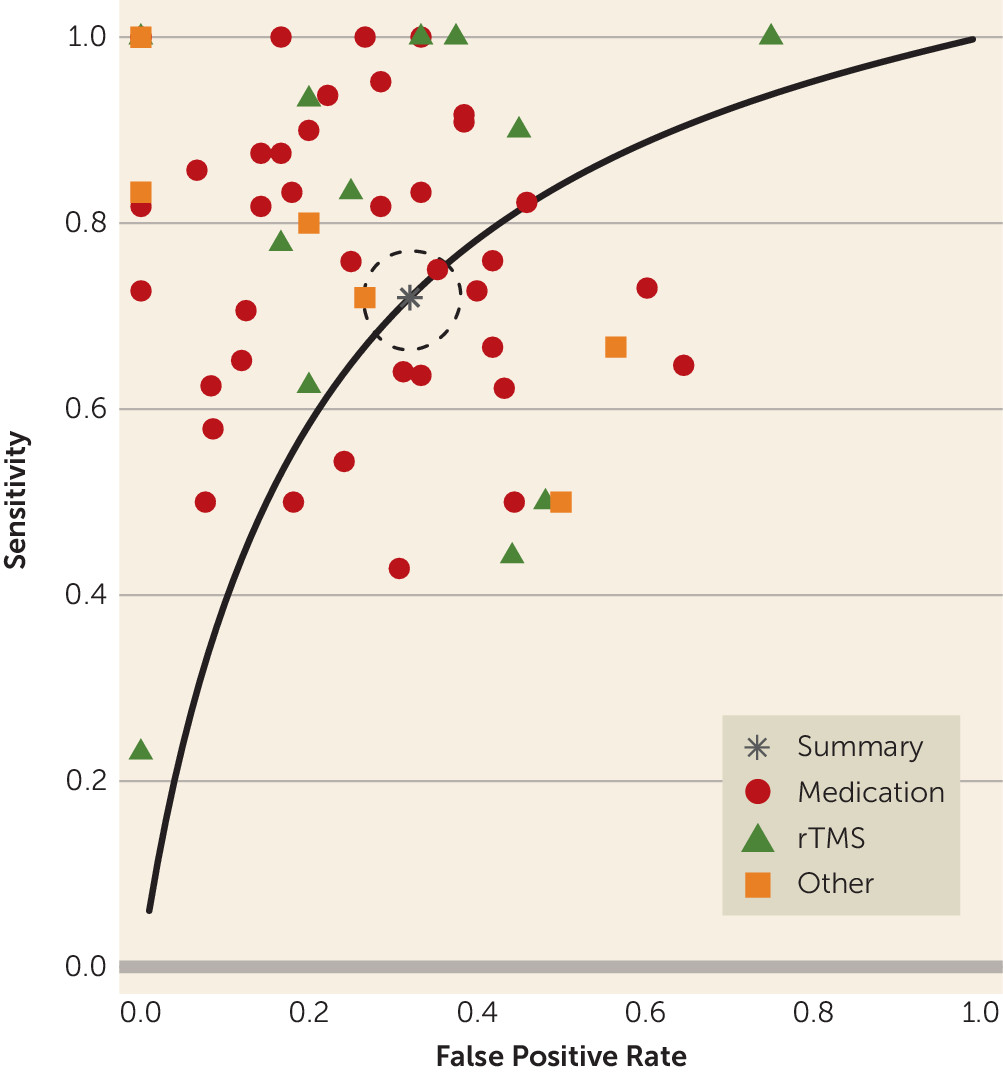
79). Bivariate analysis used sensitivity and specificity following the approach of Reitsma et al. (
97). From the bivariate analysis, we derived the area under the summary receiver operator curve and computed an area-under-the-curve confidence interval by 500 iterations of bootstrap resampling with replacement. For the univariate analysis, we report I
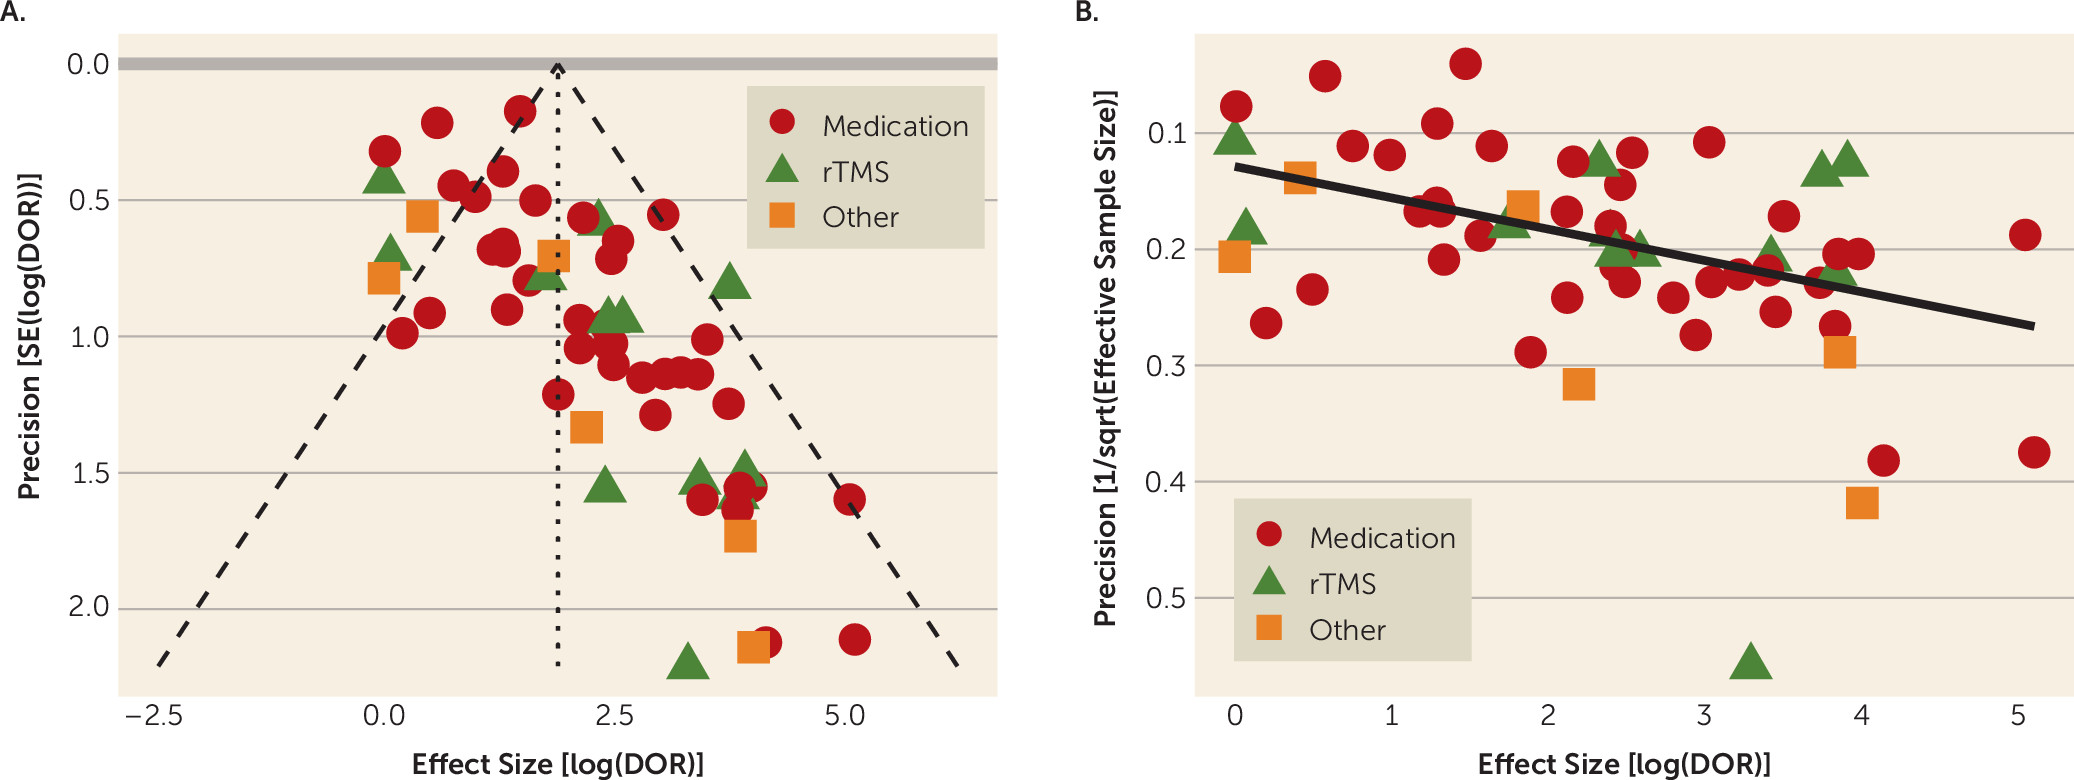
2 as a measure of study heterogeneity. As secondary analyses, we separated studies by biomarker type (LDAEP, power features, ATR, cordance, and multivariate) and by treatment type (medication, rTMS, or other). These were then entered as predictor variables in bivariate meta-regressions. Finally, to assess the influence of publication bias, we plotted log(diagnostic odds ratio) against its precision, expressed as both the standard error (funnel plot) and the effective sample size (
98). We tested funnel plot asymmetry with the arcsine method described in Rücker et al. (
99), as implemented in the
meta package (
100). This test has been suggested to be robust in the presence of heterogeneity and is the recommended choice of a recent working group (
101). All of the above were preplanned analyses. Our analysis and reporting conform with the PRISMA guidelines (
102); the checklist is included in the
online supplement. The
supplement also reports an alternative approach using standardized mean differences.
Discussion
QEEG is commercially promoted to psychiatrists and our patients as a “brain map” for customizing patients’ depression treatment. Our findings indicate that QEEG, as studied and published to date, is not well supported as a predictive biomarker for treatment response in depression. Use of commercial or research-grade QEEG methods in routine clinical practice would not be a wise use of health care dollars. This conclusion is likely not surprising to experts in QEEG, who are familiar with the limitations of this literature. It is important, however, for practicing psychiatrists to understand the limitations, given the availability of QEEG as a diagnostic test. At present, marketed approaches do not represent evidence-based care. This mirrors other biomarker fields, such as pharmacogenomics and neuroimaging, for which recent reviews (
4,
110) suggest that industry claims substantially exceed the evidence base. Like those markers, QEEG may become clinically useful, but only with further and more rigorous study.
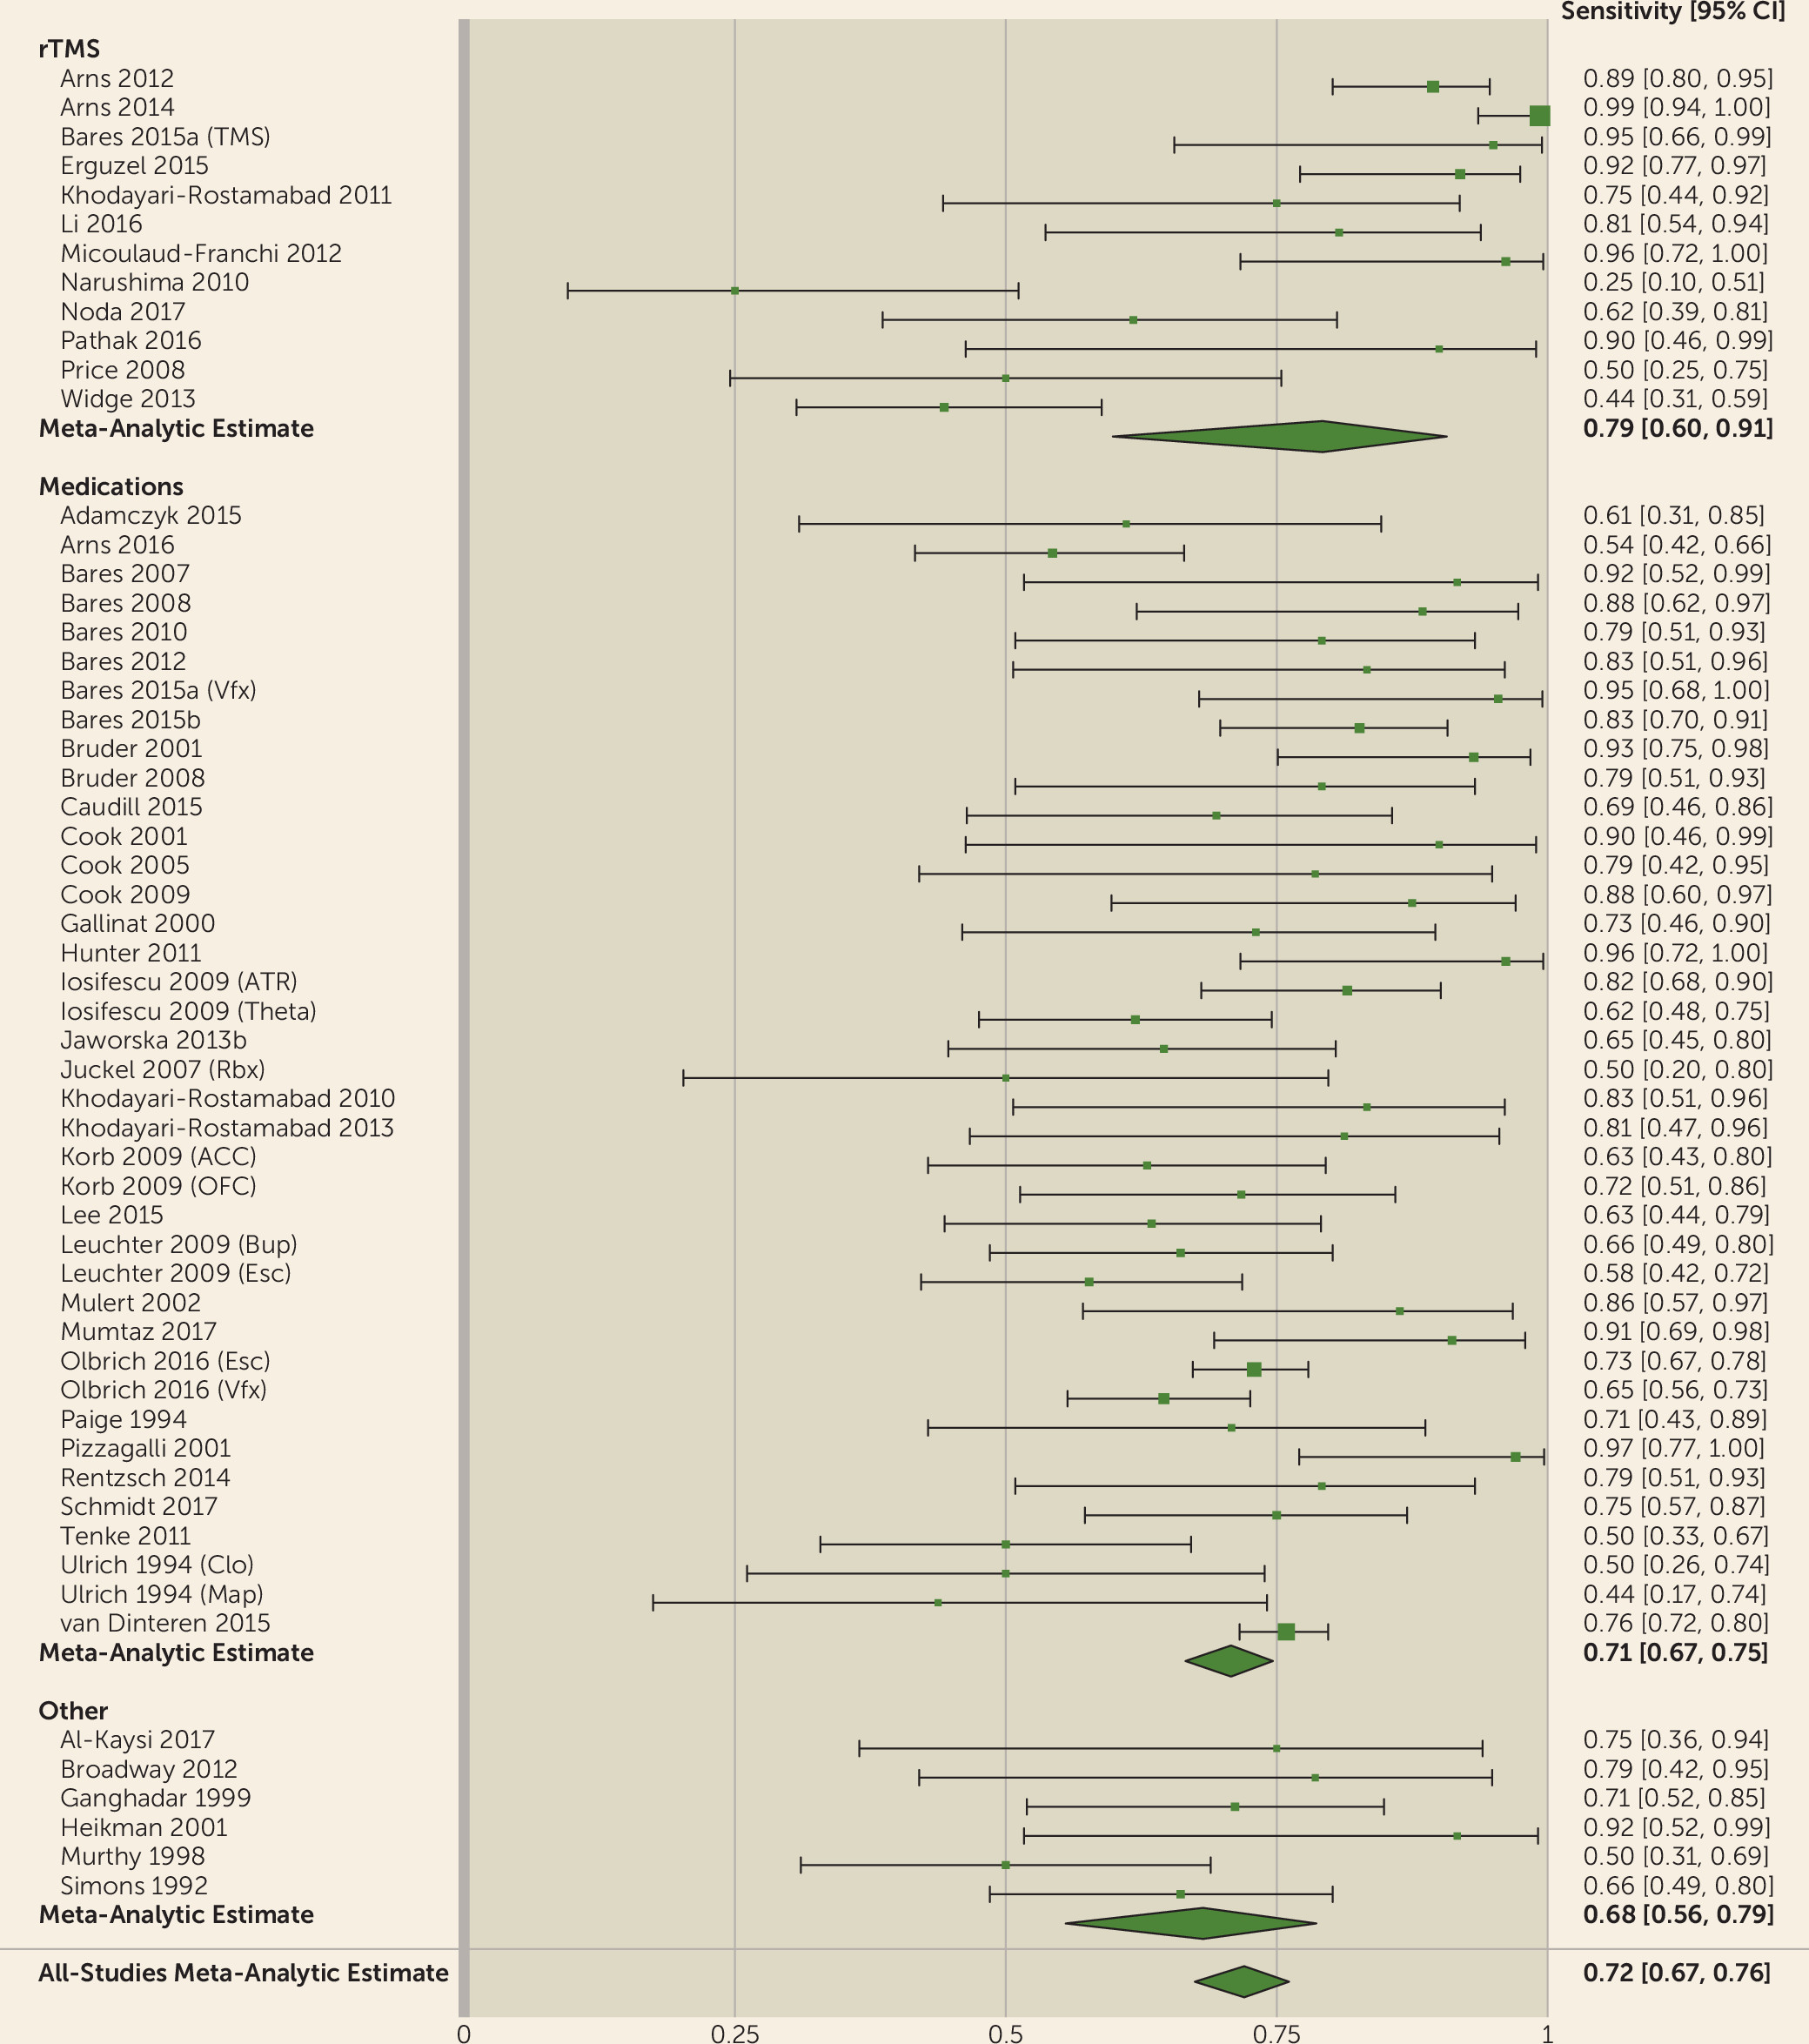
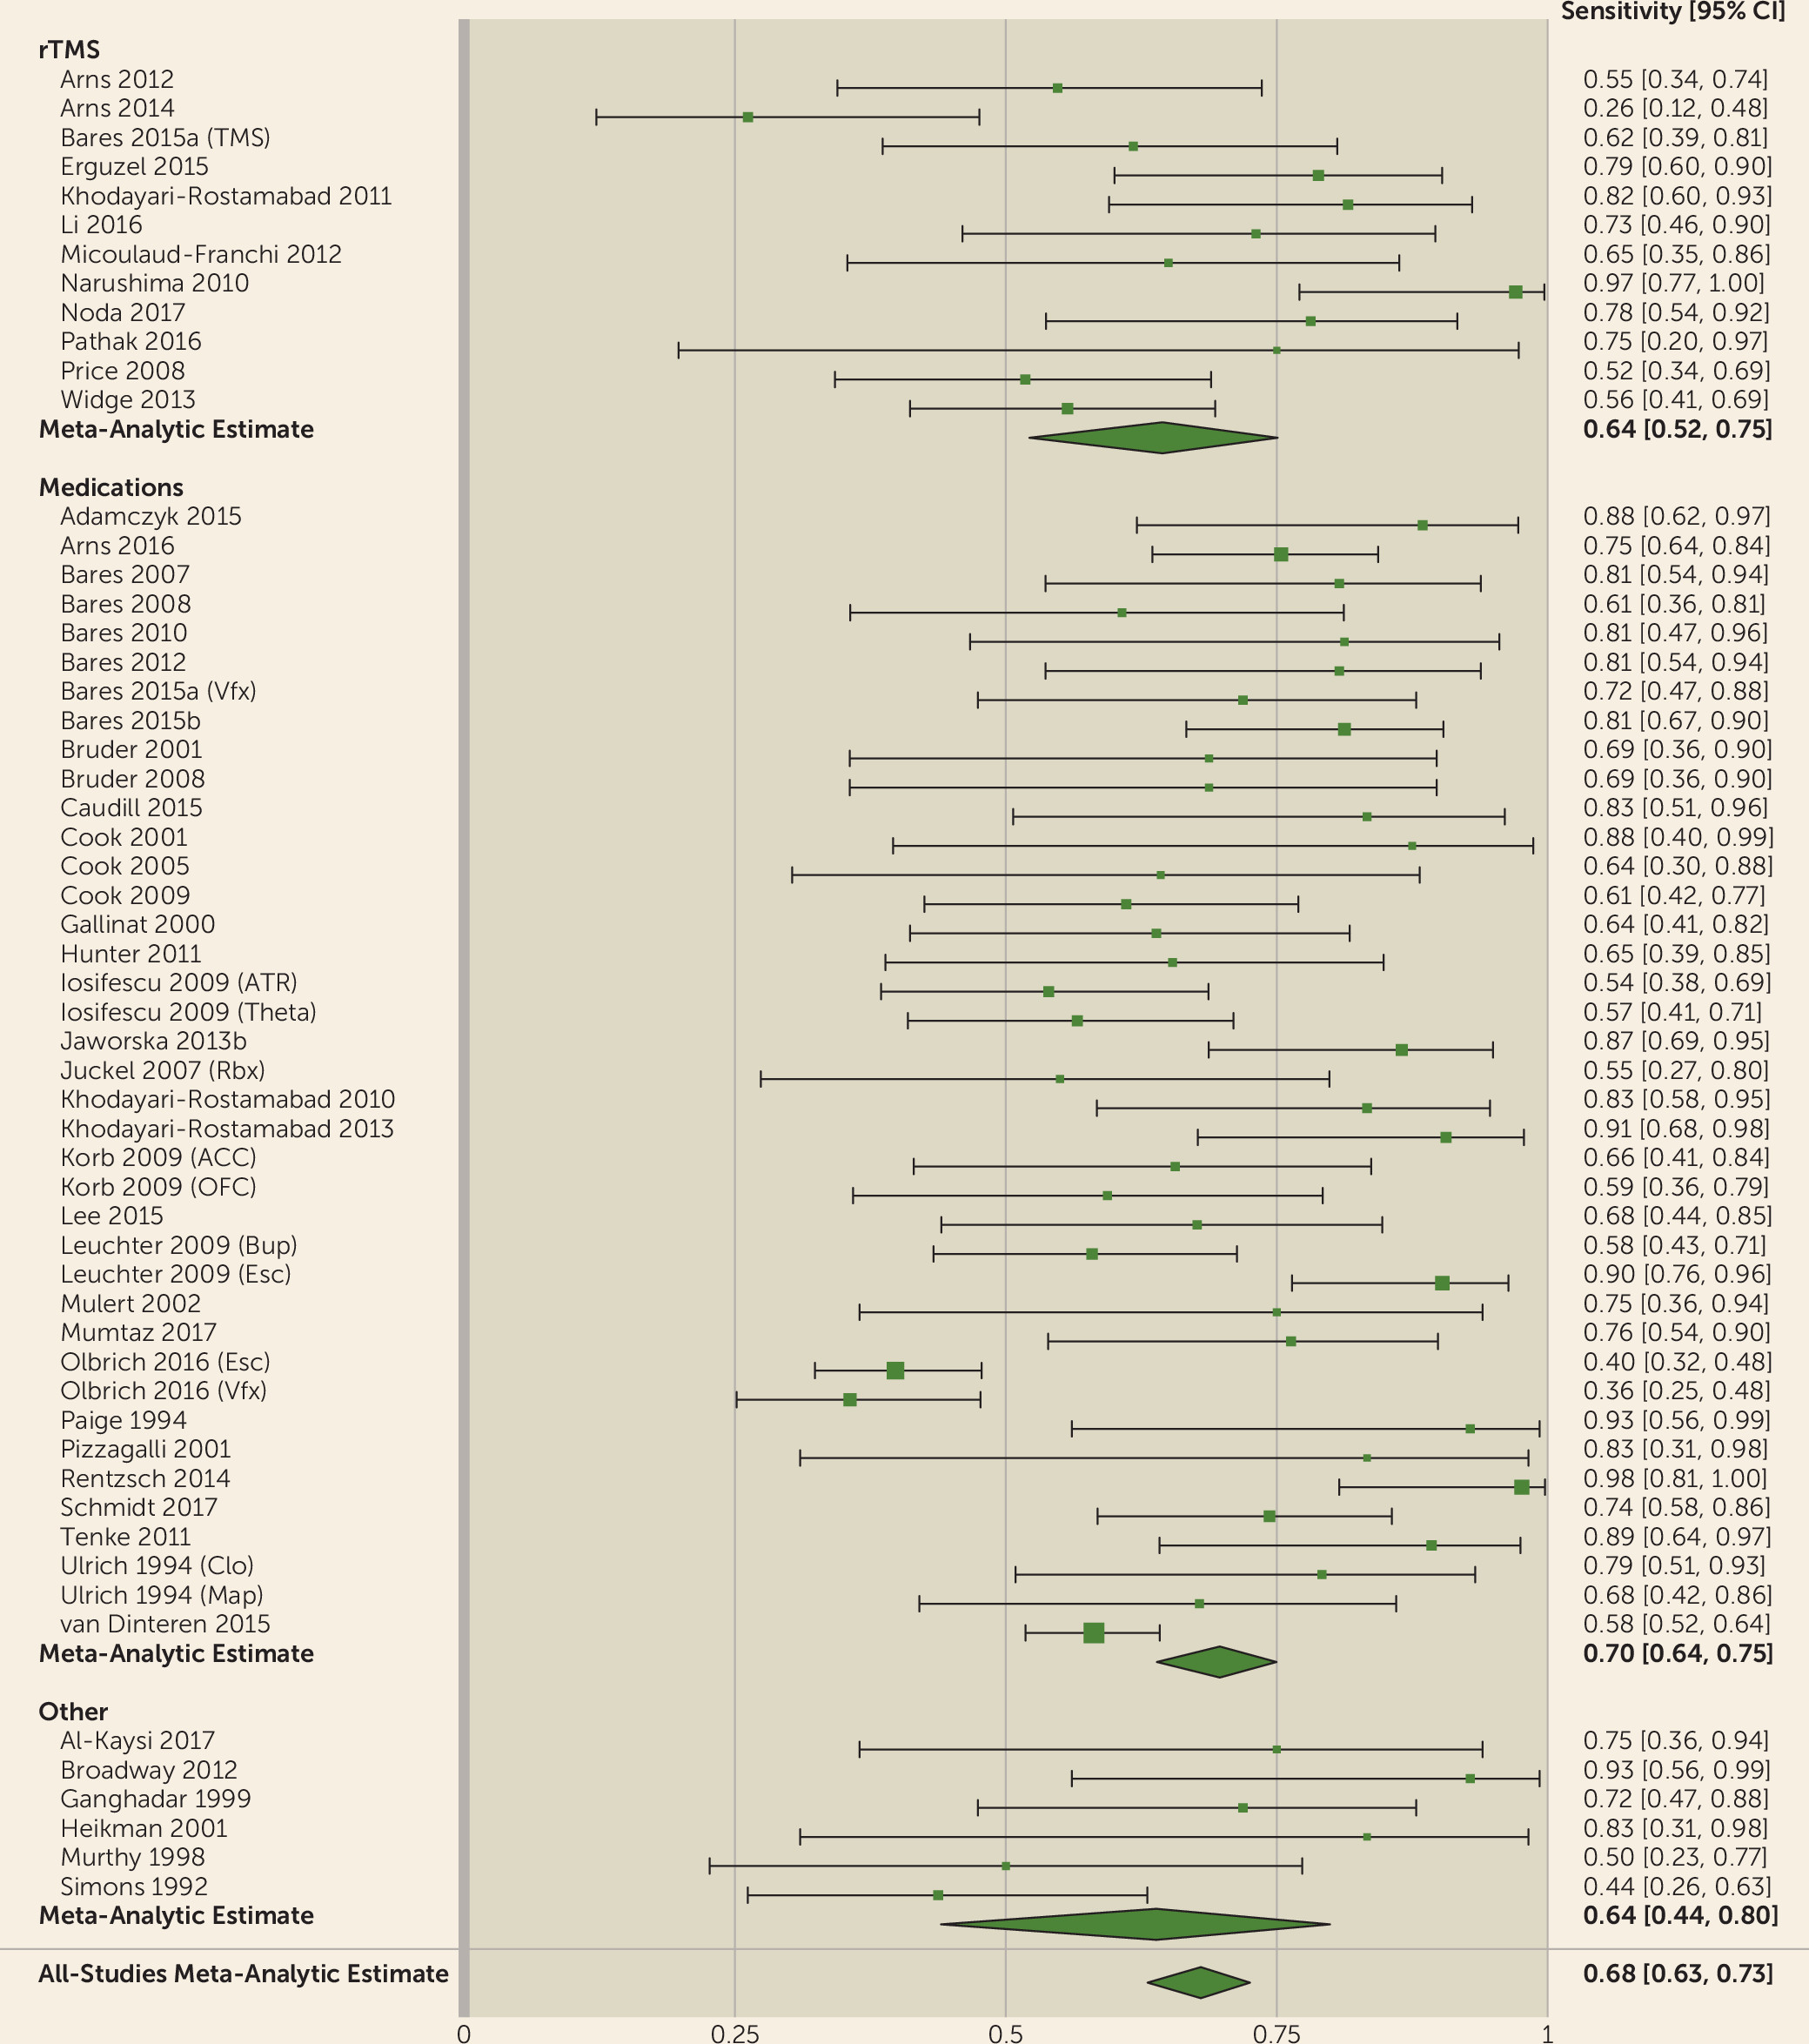
We showed that the QEEG literature generally describes tests with reasonable predictive power for antidepressant response (sensitivity, 0.72; specificity, 0.68). This apparent utility, however, may be an artifact of study design and selective publication. We observed a strong funnel plot asymmetry, indicating that many negative or weak studies are not in the published literature. Of those that were published, many have small sample sizes. Small samples inflate effect sizes, which may give a false impression of efficacy (
111). This is doubly true given the wide range of options available to EEG data analysts, which can lead to inadvertent multiple hypothesis testing (
93). We also identified a common methodological deficit in the lack of cross-validation, which could overestimate predictive capabilities. Taken together, the findings suggest that community standards in this area of psychiatric research do not yet enforce robust and rigorous practices, despite recent calls for improvement (
11,
77,
93). Our results indicate that QEEG is not ready for widespread use. Cordance and cingulate theta power are closest to proof of concept, with studies reporting successful treatment prediction across different medication classes and study designs (
14,
29,
31,
47–
49,
51,
105). ATR has been successful across medication classes, but only when tested by its original developers (
58,
59). A direct and identical replication of at least some of those findings is still necessary. These design and reporting limitations suggest that QEEG has not yet been studied or validated to a level that would make it reliable for regular clinical use.
We designed this meta-analysis for maximum sensitivity, because we sought to demonstrate QEEG’s lack of maturity as a biomarker. This makes our omnibus meta-analytic results overly optimistic and obscures three further limitations of QEEG as a response predictor. First, we accepted each individual study’s definition of the relevant marker without enforcing consistent definitions within or between studies. For example, alpha EEG has been defined differently for different sets of sensors within the same patient (
34) and at different measurement time points (
60). Enforcing consistent definitions would attenuate the predictive signal, because it reduces “researcher degrees of freedom” (
77). On the other hand, an important limitation of our meta-analysis is that it could not identify a narrow biomarker. If QEEG can predict response to a single specific treatment or response in a biologically well-defined subpopulation, that finding would be obscured by our omnibus treatment. Marker-specific meta-analysis (as in reference
76) would be necessary to answer that question.
Second, we did not consider studies as negative if they found significant change in the “wrong” direction. For instance, theta cordance decline during the first week of treatment is believed to predict medication response (
26,
47,
48,
51,
52,
55). Two studies reported instead that a cordance increase predicted treatment response (
46,
53). LDAEP studies have reported responders to have both higher (
17,
19,
20) and lower (
15) loudness dependence compared with nonresponders. This could be explained by differences in collection technique, or in the biological basis of the interventions (e.g., the inconsistent study used noradrenergic medication, whereas LDAEP is thought to assess serotonergic tone). It could also be explained by true effect sizes of zero, and modeling these discrepancies differently would reduce our estimates of QEEG’s efficacy.
Third, and arguably most important, depression itself is heterogeneous (
6,
112). Defining and subtyping it is one of the major challenges of modern psychiatry, and there have been many proposals for possible endophenotypes (
6,
9,
12,
113,
114). When we consider that each primary study effectively lumped together many different neurobiological entities, the rationale for QEEG-based prediction is less clear. As an example, a recent attempt to validate an obsessive-compulsive disorder biomarker, using the originating group’s own software, showed a significant signal in the opposite direction from the original study (
115). Furthermore, studies often predict antidepressant response for patients receiving medications with diverse mechanisms of action. Considering that patients who do not respond to one medication class (e.g., serotonergic) often respond to another (e.g., noradrenergic or multireceptor), it does not make sense for any single EEG measure to predict response to multiple drug types. Similarly, although the goal of many recent studies is to explicitly select medication on the basis of a single EEG recording (
40,
70,
72,
78), this may not be possible given the many ways in which neurotransmitter biology could affect the EEG. Reliable electrophysiologic biomarkers may require “purification” of patient samples to those with identifiable circuit or objective behavioral deficits (
6,
116) or use of medications with simple receptor profiles. It may also be helpful to shift from resting-state markers to activity recorded during standardized tasks (
6) as a way of increasing the signal from a target cortical region. Task-related EEG activity has good test-retest reliability, potentially improving its utility as a biomarker (
71).
We stress that our meta-analysis means that QEEG as currently known is not ready for routine clinical use. It does not mean QEEG research should be stopped or slowed. Many popular QEEG markers have meaningful biological rationales. LDAEP is strongly linked to serotonergic function in animals and humans (
117). Cordance was originally derived from hemodynamic measures (
11,
54). Neither cordance nor ATR changed substantially in placebo responders, even though both changed in medication responders (
26,
59,
117). The theta and alpha oscillations emphasized in modern QEEG markers are strongly linked to cognition and executive function (
62,
118). Our results do not imply that QEEG findings are not real; they call into question the robustness and reliability of links between symptom checklists and specific aspects of resting-state brain activity. If future studies can be conducted with an emphasis on rigorous methods and reporting, and with specific attempts to replicate prior results, QEEG still has much potential.
Acknowledgments
Preparation of this work was supported in part by grants from the Brain and Behavior Research Foundation, the Harvard Brain Science Initiative, and NIH (MH109722, NS100548) to Dr. Widge. The authors further thank Farifteh F. Duffy, Ph.D., and Diana Clarke, Ph.D., of the American Psychiatric Association, for critical administrative and technical assistance throughout preparation.
This article is derived from work done on behalf of the American Psychiatric Association (APA) and remains the property of APA. It has been altered only in response to the requirements of peer review. Copyright © 2017 American Psychiatric Association. Published with permission.
