It is well established that MS-associated cognitive impairment is associated with general MRI measures of disease burden such as the total area or volume of T
2 lesions (TLA),
1–8 cerebral volume,
2,7,9 corpus callosum size,
5,7,10 and third ventricle volume or width (3VW).
5,11,12 In contrast, correlations between region-specific pathology on MRI and specific cognitive deficits are rarely reported. Arnett and colleagues
1 showed that patients with a high ratio of frontal to nonfrontal T
2 lesion area were more likely to exhibit defective performance on the Wisconsin Card Sorting Test, a measure of executive ability. However, this finding was not replicated in a more recent study using different methodology.
13 Most of these studies have employed T
2 lesion area as the primary MRI measure. In MS, T
2 hyperintensities most often occur in the cerebral white matter, and as such they are likely to have wide-ranging neurobehavioral effects that involve both anterior and posterior neural networks. Therefore, statistical association between T
2 lesion area and specific neuropsychological (NP) tests should be difficult to identify in the MS population.
Recent research has focused on the destructive potential of the MS disease process in causing tissue loss and atrophy in the brain.
14,15 Such atrophy occurs early in the disease process and shows a closer correlation with physical disability than T
2 lesions.
15 Although atrophy is an anatomically general measure of disease burden, it may also be fruitful to examine atrophic change in specified regions of the cortex. Global atrophy measures have been examined in MS patients, but little is known about how regional measures of cortical atrophy interact with neuropsychological function.
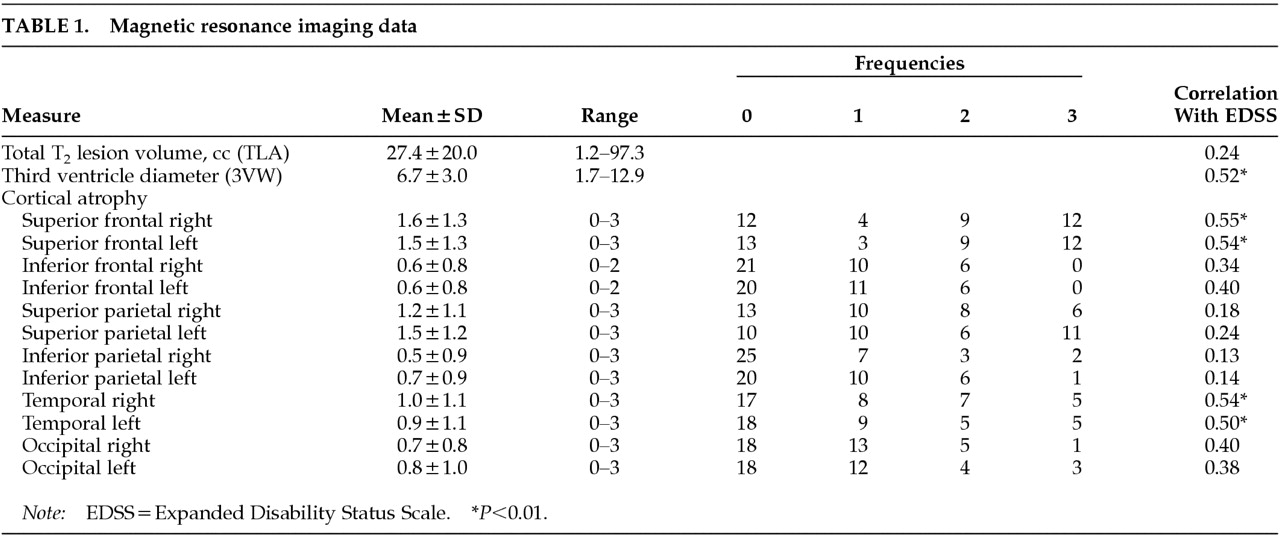
The goal of this study was to determine if there is an association between regional ratings of cortical atrophy and NP impairment in MS patients. There were two specific objectives. First, we investigated whether quantitative computer-assisted measures of TLA and/or 3VW predict NP dysfunction. Second, after accounting for variance in NP testing associated with these general measures, we asked if additional predictive variance would be accounted for by region-specific ratings of cortical atrophy. When both global and regional MRI atrophy measures were regressed on objective tests of language, spatial processing, memory, attention, and conceptual reasoning, the regional measures contributed significant predictive variance.
METHODS
Subjects
We studied 35 patients with clinically definite or laboratory-supported MS.
16 Recruitment procedures were described in a previous publication.
17 In brief, the patients were either consecutive clinical referrals for NP evaluation or respondents to advertisement for MS patients with cognitive/emotional problems. The study was approved by the State University of New York at Buffalo Institutional Review Board (IRB), and informed consent was obtained prior to each patient's participation. In addition to NP testing, patients underwent MRI and neurological examination to derive an Expanded Disability Status Scale (EDSS) rating of physical disability.
18 Some patients also participated in additional studies of personality and a psychological intervention designed to diminish the frequency of socially aggressive behaviors. The results of the psychological studies will be presented in separate reports.
Twenty-one patients had a progressive form of MS and 14 had relapsing disease. EDSS scores ranged from 1.0 to 8.5 (mode=3.0). There were 32 Caucasian patients and 3 African-Americans. Sixty-six percent (
n=23) of the patients were female. Premorbid IQs were estimated by the method of Barona et al.,
19 and the sample mean was 109.3 (SD=7.8). In contrast, the mean current IQ derived from a short form of the Wechsler Adult Intelligence Scale–Revised
20 was 92.4 (SD=14.4).
Patients were excluded if structured interview revealed history of other neurological disease, drug or alcohol dependence, psychiatric disorder other than psychological problems developing in the context of MS, or clinical MS relapse (or corticosteroid treatment) within 3 weeks of participation. None of the patients reported psychiatric treatment predating MS diagnosis. Use of anxiolytic and antidepressant medications was permitted, although no patient met diagnostic criteria for major depressive episode at the time of the study.
Neuropsychological Testing
Neuropsychological testing was performed by a trained technician, supervised by a board-certified clinical neuropsychologist. Depression was quantified by using the Beck Depression Inventory (BDI).
21 The original battery of cognitive tests was based on review of previous MS studies,
22,23 and was then reduced to one variable per domain to limit the number of statistical tests as much as possible. Language was assessed by the Boston Naming Test, a measure of visual confrontation naming.
24 Spatial processing was assessed with the Judgment of Line Orientation Test, which emphasizes the perception of line angles.
25 The learning recall trials from the California Verbal Learning Test
26 and the revised Brief Visuospatial Memory Test
27 were used to assess new learning capacity. Attention and/or rate of processing was examined by the Paced Auditory Serial Addition Test.
28 Set shifting and conceptual reasoning were examined by using the perseverative response index from the Wisconsin Card Sorting Test
29 and the error score derived from the Booklet Category Test,
30 respectively.
MRI Acquisition and Analysis
Brain MRI was performed on a 1.5-T scanner (General Electric, Milwaukee, WI). The protocol included a 5-mm-thick (2.5-mm interslice gap) axial T1-weighted series (450/19) with a 256×256 matrix, a 22-cm field of view, and two excitations and an axial 5-mm (2.5-mm interslice gap) dual-echo, conventional spin-echo series acquired with intermediate and T2 weighting (2,100, 30/85), with a 256×256 matrix, a 22-cm field of view, and one excitation. Individuals who were unaware of clinical details made the MRI measurements (R. Bakshi, J.H.S.).
Two quantitative, general MRI measures of disease burden were obtained at the University of Colorado Health Sciences Center (Denver, CO), based on manual tracings on a computer workstation using previously described methods.
14,31 Total T
2 hyperintense lesion area (TLA) was determined by using tracings from paired proton-density and standard T
2-weighted images by an experienced image analysis technician. The values were calculated by multiplying lesion area by the sum of slice thickness and slice gap. Third ventricular width (3VW) was based on axial T
1-weighted series determined along a plane corresponding to the (anteroposterior) midpoint of the ventricle. The intra-observer mean coefficient of variation was previously shown to be 3% for this method.
14Cortical atrophy was measured in relation to age-matched control subjects by an experienced observer using an ordinal rating scale according to the method of Bakshi and co-workers.
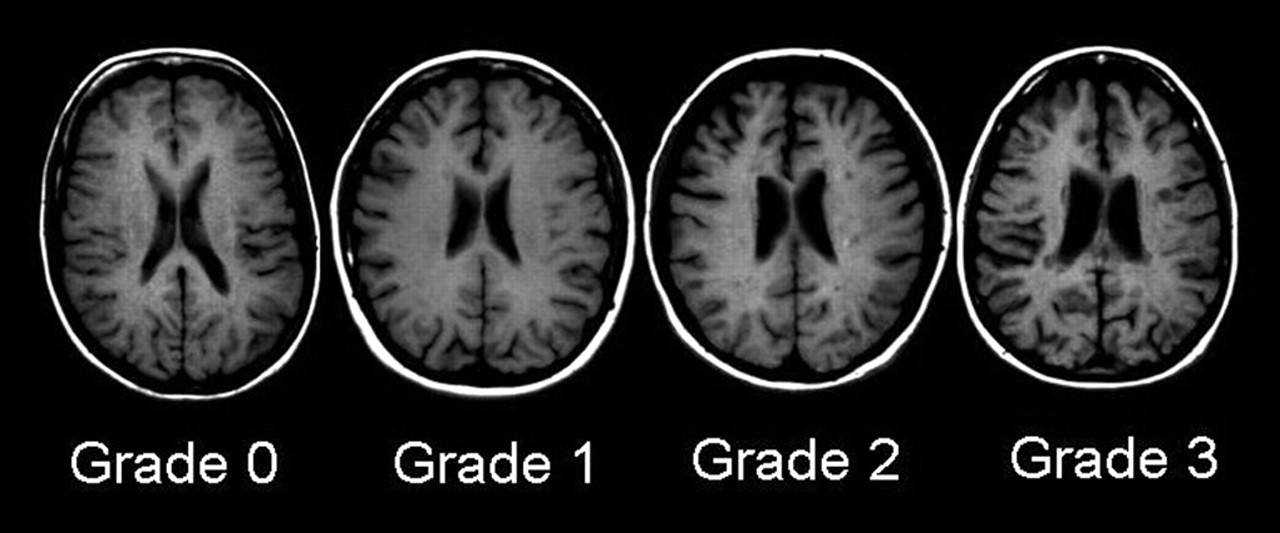
15,32–36 Cortical atrophy was rated in six lobar regions in each hemisphere: superior frontal, inferior frontal, superior parietal, inferior parietal, occipital, and temporal. Standard fissures were used to separate the various lobes, including the central (rolandic), lateral (sylvian), and parieto-occipital sulci. The third ventricle demarcated superior versus inferior frontal and parietal lobes. All axial slices showing the region were analyzed. We used an ordinal rating system that assessed severity of enlargement of subarachnoid spaces (sulci and fissures) in the above-mentioned regions on axial noncontrast T
1-weighted images. Each patient was rated against an age- and gender-matched normal control scan, selected from a standard, normative MRI database of 100 control subjects. The degree of atrophy was rated as normal (grade 0), mild (<10%, grade 1), moderate (10%–25%, grade 2), or severe (>25%, grade 3), according to the percentage of volume loss of parenchyma in the entire region. Examples of these ratings from subjects in our database are presented in
Figure 1. The intra-observer agreement of data obtained by this MRI atrophy technique is high (mean kappa 0.9, range 0.8–1.0) and the inter-observer agreement is moderate to very good (mean kappa 0.8, range 0.6–1.0).
15,34Procedure
All participants underwent an initial structured telephone screening interview, emphasizing previous medical history and DSM-IV
37 criteria for psychiatric disorder. The interview was standardized across participants and included questions pertaining to previous psychiatric history and current symptoms of depressive disorder. After screening, participants were scheduled for neuropsychological and neurological examinations. MRI scans were performed for patients without a clinical study within 6 months of testing. The MRI data were digitized and shipped to the Colorado Health Sciences Center, where they were analyzed with quantitative techniques. Hard copy images were read to obtain the ordinal measures of cortical atrophy. All MRI analyses were blind to NP and clinical data. All participants provided signed, IRB-approved, informed consent prior to participation.
Statistical Analyses
All group comparisons and correlations were evaluated by using a conservative threshold of P<0.01. Linear regression analysis with forward stepwise selection was the primary method of analysis. First, TLA and 3VW were regressed on the NP measures in separate models. Conservative selection criteria (entrance 0.01, exit 0.05) were employed to reduce the likelihood of a chance finding. In the second stage of analysis, cortical atrophy measures were regressed on the same criterion measures using the same selection criteria. However, in this stage, the forward selection procedure was preceded by the entrance of either TLA or 3VW, depending on which general measure had accounted for most variance in the previous stage. The general measure was retained in each model in fixed fashion. In this way, we answered the question of whether cortical atrophy accounts for predictive variance in cognitive function after accounting for the influence of general cerebral pathology.
Unlike the NP and volumetric MRI variables, the cortical MRI ratings were not, in most cases, normally distributed by Kolmogorov-Smirnov test. Therefore, where possible, nonparametric statistical tests were employed for these measures. Such an accommodation was not possible for testing the primary hypotheses with linear regression.
DISCUSSION
Previous attempts to identify relationships between specific lesion locations and cognitive defects have relied primarily on measures of regional white matter (WM) lesion load. Swirsky-Sacchetti et al.
8 found that left frontal lesion area predicted perseverative responses on the Wisconsin Card Sorting Test (WCST). Although the authors did not control for total lesion load, Arnett et al.
1 controlled for this factor by dividing patients into those with and without predominantly frontal lesions. These subgroups were matched on TLA. Frontal pathology was again associated with WCST errors. Yet this finding was not replicated by Foong et al.
4 in a more recent study of executive ability and quantified lesion volume. In this study, lesion volumes were quantified using an automated method with a line drawn through the central sulcus to demarcate the frontal regions. Frontal lesion area correlated highly with TLA, and both measures were correlated with failures on executive tasks. When the sample was divided based on a median split of the frontal/total lesion volume ratio, there were no differences on any of the executive measures. Thus, the evidence supporting a reliable relationship between localized T
2 lesions and specific cognitive impairments is, at best, inconsistent.
Given that the cerebral white matter connects various regions of the cerebral cortex, such difficulty in identifying specific WM lesion–cognition correlations is not unexpected. On the other hand, atrophic change in specified areas of the cortex may be more likely to show focal cognitive effects. We found this to be the case in four NP tests emphasizing new learning, divided attention, and conceptual reasoning. Not only were failures on these tests correlated strongly with superior frontal cortex atrophy, but the predictive relationship held after controlling for the influence of TLA and 3VW. Superior frontal cortex has been shown to be active during a range of new learning and executive ability tasks.
38–41 Consequently, the importance of this region in our statistical models of cognitive dysfunction is compatible with previous neuropsychological research.
Brain atrophy is a topic of increasing interest to neurologists caring for MS patients. Atrophy correlates well with neurologic function and is associated with progressive neurologic disability.
14,15 Unfortunately, the etiology of MS-associated brain atrophy is not well understood, but it may be due to focal white matter damage in tracts that underlie the affected region of the cortex.
14,15 Wallerian degeneration may occur distal from the focal WM lesion and contribute to tissue loss. In this regard, it is remarkable that much higher ratings of atrophy were discovered in the superior aspect of the frontal lobe, as compared with the inferior aspect. As these regions are also more susceptible to WM lesions,
42 our data support a role of WM disease in the development of focal atrophy. This is also consistent with previous fluorodeoxyglucose PET work from our group showing more prominent hypometabolism in the superior versus inferior aspect of the frontal cortex in MS.
43In the present study, the severity of cortical sulcal enlargement was measured in comparison to age-matched normal control subjects. We recently demonstrated that these visually determined region-by-region severity measures of atrophy show significant correlations with brain hypometabolism detected quantitatively by fluorodeoxyglucose brain PET,
34 supporting the validity of this MRI rating method. Although this method is qualitative and rater-dependent, and does not account for subtle sulcal variability in normal individuals, these atrophy measures can be obtained rapidly from hard copies of images and are practical in the clinical setting. Computer-assisted, quantitative methods of assessing cortical atrophy have been developed,
44 but they require extensive, time-consuming analyses and, as such, are not yet applicable to the clinic setting. Given the robust correlations between cognitive function and the ordinal cortical atrophy indices obtained here, we tentatively propose that this and similar methods might be used to identify patients at high risk for cognitive impairment, and in turn, vocational disability. Future studies should be pursued to confirm and extend our findings, using computer-assisted methods that will further validate the rating method and more precisely quantify regional cortical atrophy.
One caveat concerns the composition of our study sample, which included clinical referrals and patients responding to advertisement. Although we previously showed that this sample is impaired on NP testing,
17 it is likely that these patients reflect a subpopulation of MS who experience cognitive and personality change, and thus are more likely to present with cerebral pathology. Although many of our patients presented with some symptoms of depressive or adjustment disorder, none met diagnostic criteria for major depressive episode.
37 Depressive symptoms are common in MS,
45–48 and the mean BDI score reported here is similar to that reported in other studies.
49 On the other hand, the degree of atrophy and T
2 lesion volume was high in comparison to other recent research using similar methods.
14,31 Although the degree of impairment in our sample may limit the generalizability of our findings, it is also important to note that the range of MRI values was probably restricted. It is likely that a more heterogeneous and representative sample would result in more robust correlative findings. Another methodological concern was the use of predictor variables that are not normally distributed (i.e., ordinal rather than ratio scale). The criterion measures were, however, normal, as were the general MRI predictors. The use of predictor variables that deviate from normal would not cause spurious results, but rather would reduce statistical power. Had our study employed computer-assisted continuous measurement of cortical atrophy, the test of the primary hypothesis would have been stronger. Such an approach is currently under development at our center.
These methodological concerns notwithstanding, we conclude that cortical atrophy as measured by blind ratings of enlargement of subarachnoid spaces (sulci, fissures, cisterns) is associated with cognitive dysfunction in MS. The association is strong when examined with simple correlation coefficients, and it remains reliable after controlling for the influence of total T2 lesion area and the diameter of the third ventricle. The regions of the brain most integral to cognitive morbidity are the superior frontal cortices.


