Alzheimer's disease (AD) is characterized by several neuropathologic findings, including amyloid plaques, neurofibrillary tangles, and neuronal loss in the cortex and hippocampus.
1 Neuroimaging studies have demonstrated hypometabolism in the temporal, parietal, and frontal cortical lobes in AD.
2,3 Subcortical white matter hyperintensities (SH) seen with magnetic resonance imaging (MRI) have been independently observed to be more extensive in patients with AD than in age-matched healthy control subjects.
4–7There is limited understanding of the significance of SH. In subjects with and without AD, periventricular hyperintensities (PVH) may represent denudation of the ventricular lining, while deep white matter hyperintensities (DWMH) probably represent loss of myelinated axons.
4,5 Some investigators have suggested that SH are a feature of aging or an epiphenomenon of brain atrophy in AD.
4,8,9 Others have associated vascular risk factors or disease with the presence of SH.
10,11 Brain perfusion studies have yielded no consistent finding associated with these lesions in patients with dementia, showing either no association
12,13 or hypoperfusion in the frontal and parietal cortices
14 or hippocampal regions.
6The relationship between SH in AD and the clinical symptoms of the degenerative disorder is also uncertain. A few studies have explored associations with cognitive deficits or functional disability. No correlation has been found between the extent of SH and global cognitive deficit in some studies,
8,15 whereas others have reported correlations with cognitive impairment, reduction in activities of daily living, or frontal release signs.
7,14,16 Relationships with other symptoms of AD have not been examined. Among elderly patients without dementia, DWMH were more common in depressed patients than control subjects,
17 suggesting that these lesions may have psychiatric sequelae. Neuropsychiatric symptoms have been associated with regional cortical hypometabolism in patients with AD.
18Data from non-AD studies suggest that focal lesions affect metabolism in remote brain regions, a phenomenon known as diaschisis.
19–21 In a study of patients with vascular dementia but no cortical lesions, Sultzer et al.
22 reported that anterior PVH and lesions in subcortical nuclei were positively correlated with frontal hypometabolism, and that total subcortical white matter changes were correlated with neuropsychiatric symptoms. There are extensive neural connections between subcortical nuclei and the frontal cortex, and disruption of these frontal–subcortical circuits have been associated with neuropsychiatric symptoms.
23 Subcortical lesions may therefore affect frontal cortical function and neuropsychiatric symptomatology.
This study measured the extent of SH in patients with AD and examined the relationship of SH to cortical metabolism and clinical symptoms. We hypothesized that the extent of SH would be related to the degree of regional cortical hypometabolism and the severity of neuropsychiatric symptoms.
RESULTS
Patient Characteristics
Patients ranged in age from 61 to 85 years (mean [±SD] =70±7), and all were male. Age at onset of dementia ranged from 55 to 82 years (mean=65±8). Duration of dementia ranged from 2 to 8 years (mean=4±2). Years of education ranged from 10 to 20 (mean=14±3). MMSE scores ranged from 6 to 28 (mean=17±7). Hamilton Rating Scale for Depression (Ham-D) scores ranged from 1 to 16 (mean=7±4).
Subcortical MRI Hyperintensities
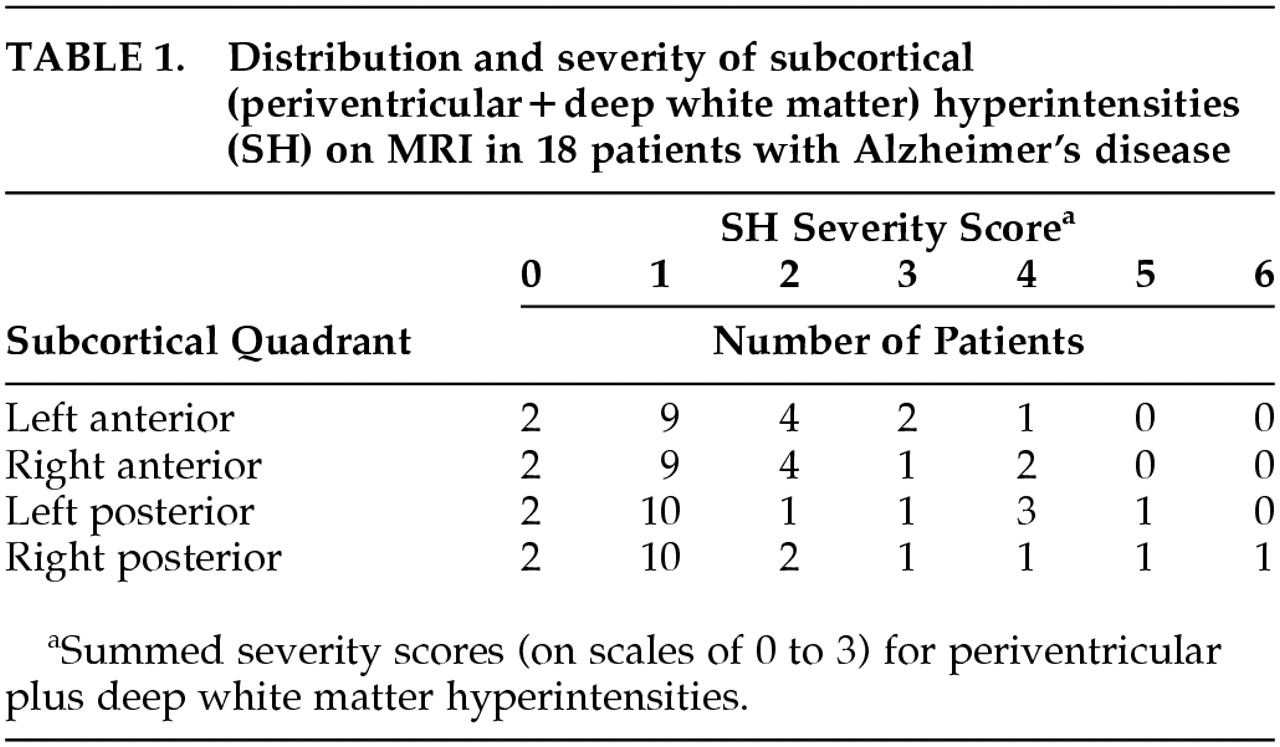
Severity of SH by quadrants for the 18 patients is shown in
Table 1. The majority of patients had mild PVH and absent DWMH. The distribution of each lesion type was similar across quadrants for the group.
Regional Subcortical MRI Hyperintensities and Cortical Metabolic Rates
There was no significant correlation (P>0.05) between SH (PVH and DWMH individually and combined) and cerebral metabolic rate for the following: each subcortical quadrant and each ipsilateral cortical lobe; each subcortical and ipsilateral cortical hemisphere; and the whole subcortex and cortex. Covarying for MMSE scores also yielded no significant correlation in the same analyses.
Anterior Subcortical MRI Hyperintensities and Relative Frontal Cortical Hypometabolism
The two most common abnormal metabolic findings associated with AD are relative parietotemporal hypometabolism, found in approximately one-half of patients, and relative frontal hypometabolism, found in approximately one-quarter of patients.
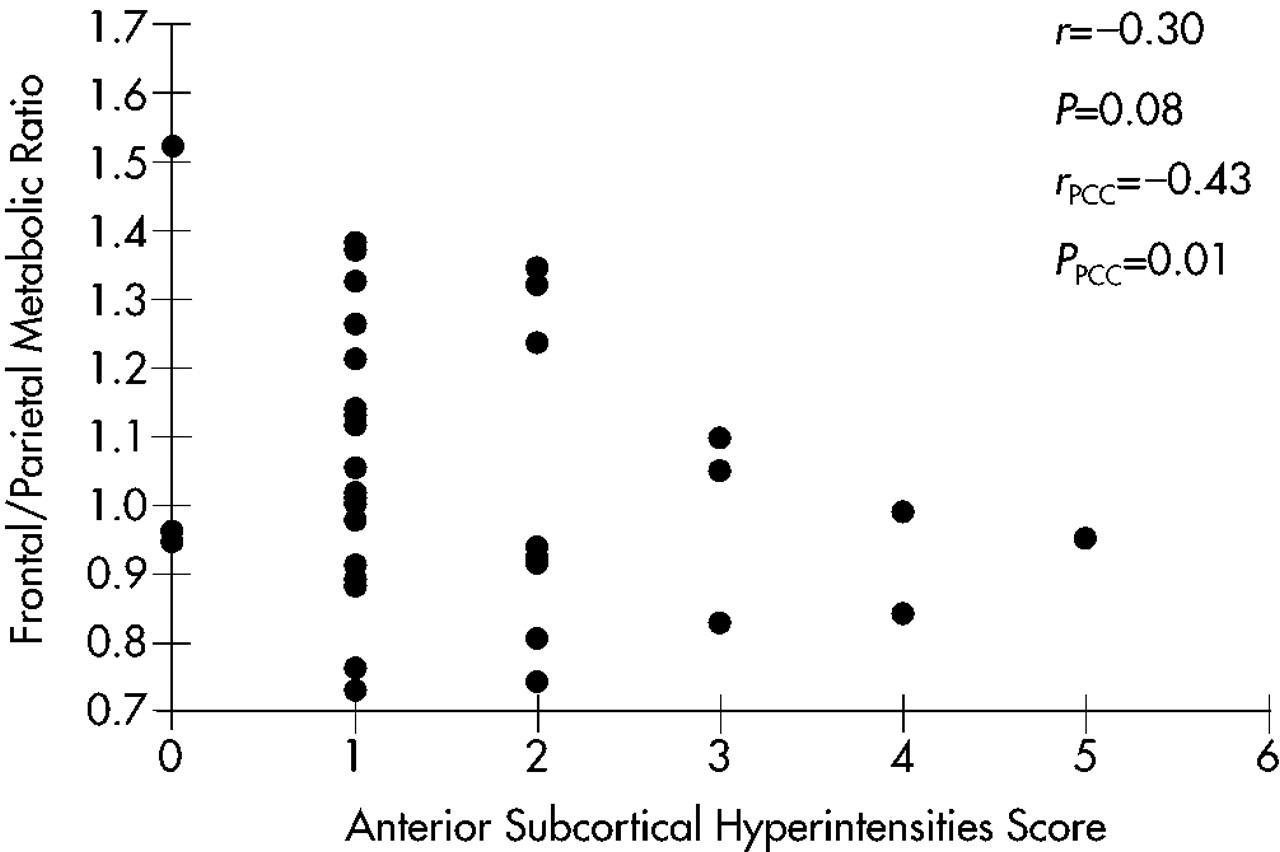
2 However, the cause of this difference between metabolic subgroups is uncertain. We hypothesized that the relative metabolic activities of anterior and posterior cortical regions might vary with the severity of SH. We calculated frontal/parietal metabolic ratios (as an estimate of anterior/posterior cortical metabolic ratios) and examined their relationship to ipsilateral anterior SH to test the hypothesis.
A scatterplot of this relationship is shown in
Figure 1. A trend toward a negative correlation (
r=–0.30,
P=0.08) was found; that is, lower frontal/parietal metabolic ratios were correlated with greater severity of anterior SH. With covariance for MMSE scores to account for the effects of dementia severity, the relationship was more robust (
r=–0.43,
P=0.01).
To determine the specificity of this relationship, Spearman partial correlation coefficients (with MMSE as covariate) were calculated for the relationships between frontal/parietal ratios and hyperintensities in the ipsilateral subcortical hemispheres (r=–0.25, P=0.15), in the ipsilateral posterior subcortical quadrants (r=–0.06, P=0.75), and in the whole subcortex (r=–0.26, P=0.32). None of these relationships was statistically significant, suggesting that the relationship of ipsilateral anterior SH to lower frontal/parietal metabolic ratios has anatomic specificity.
MRI and PET images (
Figure 2) from two patients with AD show a greater degree of relative frontal hypometabolism in the patient with greater anterior SH (bottom images) in comparison to the patient with minimal anterior SH.
Subcortical MRI Hyperintensities and Clinical Symptoms
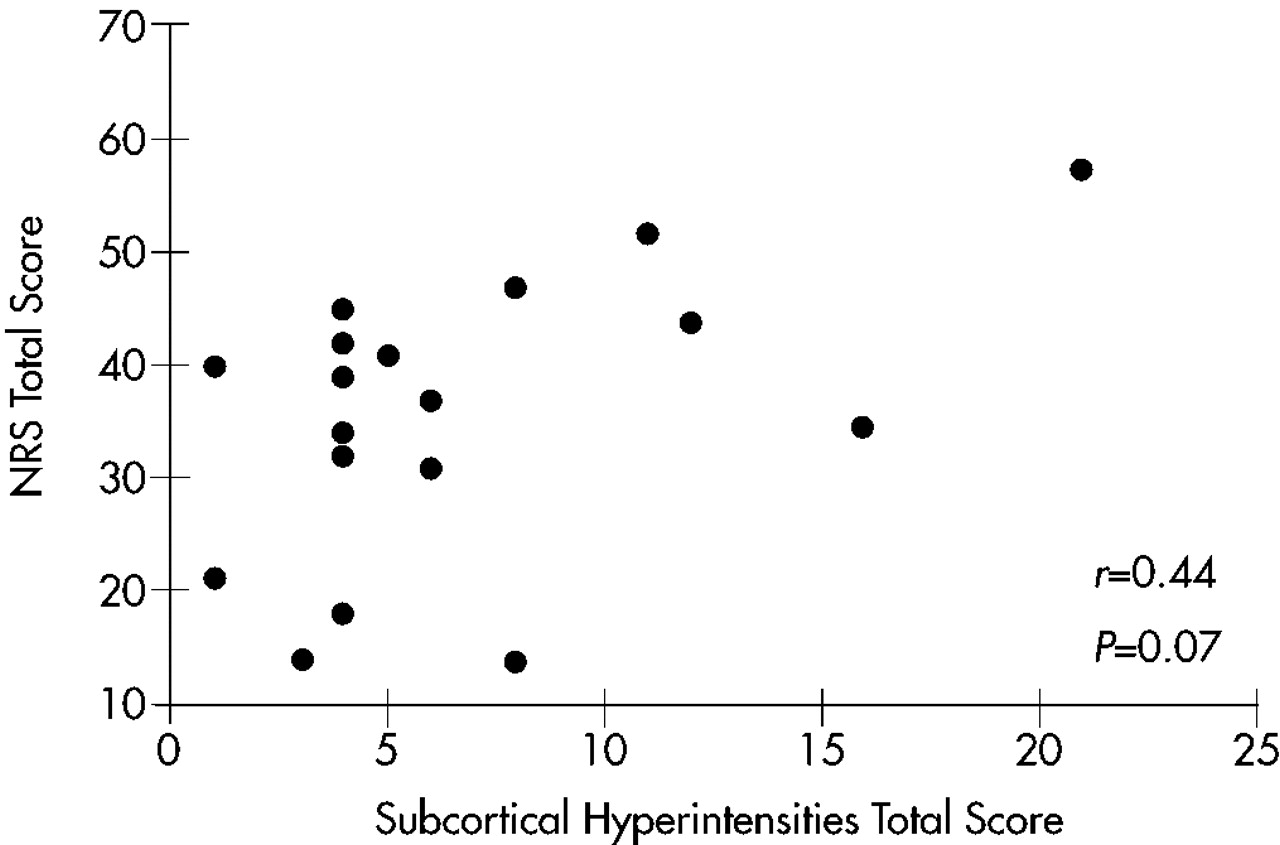
There was no significant correlation between overall SH severity and scores on any measure of clinical symptomatology: MMSE, Ham-D, Neurobehavioral Rating Scale factors, or NRS total. There was, however, a trend toward a positive correlation between overall SH severity and NRS total scores (
r=0.44,
P=0.07). A scatterplot of this relationship is shown in
Figure 3. When these analyses were repeated with MMSE scores as a covariate, results were nonsignificant.
Because of the regional subcortical effects on cortical metabolism found above, regionally specific relationships between severity of SH and neuropsychiatric symptomatology were explored. Trends toward a positive correlation between hyperintensities in the right and the anterior halves of the subcortex and NRS Psychosis factor scores were found (r=0.43, P=0.07, and r=0.41, P=0.09, respectively). These trends were not present after covarying for MMSE (r=0.35, P=0.17, and r=0.32, P=0.22, respectively). Hyperintensities in a number of subcortical regions reached or approached significant positive correlation with NRS total scores: right posterior quadrant (r=0.56, P=0.02); right hemisphere (r=0.51, P=0.03); posterior half (r=0.48, P=0.05); left anterior quadrant (r=0.45, P=0.06); and anterior half (r=0.45, P=0.06). Positive correlations between right posterior quadrant (r=0.53, P=0.03) and posterior half (r=0.48, P=0.05) SH and NRS total scores remained significant after covarying for MMSE.
DISCUSSION
This study combined structural and functional neuroimaging techniques to examine the relationship between subcortical lesions and cortical metabolic function in patients with AD. Results have potential implications for the effects of pathological processes on the function of distant brain regions and on neural tracts that connect brain regions. The network model for the working brain proposes that human mental activities are mediated by networks of interconnected brain regions.
2,41 Horwitz and colleagues used FDG-PET and cerebral metabolic rate correlation matrices to elaborate on the network model.
42–44 This method assumes that if the CMRs of two brain regions are significantly correlated, those two regions are functionally coupled; that is, the activity of one depends on or is related to the activity of the second. Among healthy older adults, many correlations occurred between frontal and parietal regions and between occipital and temporal regions.
42 However, among patients with AD, functional uncoupling between intrahemispheric neocortical regions in the frontal–parietal domains was observed.
43 The present study found that anterior subcortical MRI hyperintensities were associated with frontal hypometabolism relative to parietal metabolic function, with control for effects of dementia severity. This finding suggests that anterior subcortical MRI hyperintensities may contribute to the uncoupling of metabolic function, and possibly the disruption of neural connections, between frontal and parietal cortices in AD, independent of the effects of (cognitive) dementia severity.
A relationship between subcortical MRI hyperintensities and absolute metabolic rate in individual cortical lobes was not observed in this study. The lack of individual relationships may also be consistent with the network model. The activity of a brain region in a neural network is linked to the activity of several distributed and partially overlapping networks.
2 Accordingly, a single discrete subcortical lesion can affect function in multiple cortical regions, which reduces the specificity of one-to-one subcortical–cortical effects. Attempts to understand the independent effect of each subcortical lesion type within a specific region, which might have better addressed the proposed hypothesis, were limited by the small study group size and the heterogeneity of lesion types and locations among the patients. Moreover, several of the analyses considered hemispheric SH and cortical metabolism to be independent of contralateral effects, an assumption that may not be valid in all circumstances.
This study demonstrated limited relationships between subcortical MRI hyperintensities and neuropsychiatric symptomatology. Significant relationships were observed only with NRS total scores and not with individual symptoms. A relationship with
r>0.40 emerged between anterior SH and psychosis but did not reach statistical significance at the
P<0.05 level, possibly because of the limited sample size and statistical power. Support for the relationship between frontal pathology and psychotic symptoms is strengthened by our earlier report of an association between hypometabolism in specific frontal brain regions and delusions in AD.
45 Depression, which has been associated with subcortical lesions in patients with vascular dementia and nondemented elderly patients,
17,46 was not associated with SH in this study. The relatively low level of depression in this study group, as well as the relatively modest severity of SH, may have contributed to this finding. A relationship in AD patients between global cortical hypometabolism and overall neuropsychiatric symptomatology, as well as between regional cortical hypometabolism and noncognitive symptoms, has been reported previously.
18 Whether subcortical pathology contributes independently to the clinical expression of neuropsychiatric symptoms or does so through effects on cortical function in AD remains to be determined.
In addition to uncoupling frontal–parietal neural connections, subcortical pathology may directly affect frontal lobe function through disruption of frontal–subcortical circuits. Lesions within these circuits produce cognitive and behavioral alterations such as executive dysfunction, mood symptoms, apathy, and disinhibition.
23 These symptoms are common in AD, and executive deficits are associated with other neuropsychiatric difficulties and functional impairment.
47 FDG-PET studies of patients with subcortical degenerative diseases, including Parkinson's disease, Huntington's disease, and progressive supranuclear palsy, have demonstrated frontal hypometabolism.
48–50 In patients with vascular dementia but no cortical lesions, subcortical hyperintensities were shown to be related to frontal hypometabolism and clinical symptoms.
22 These findings, as well as the relationship between SH and relative frontal hypometabolism observed in the current study, suggest that there may be subcortical–frontal relationships that are common across neuropsychiatric disorders.
Limitations of this study deserve comment, and some conclusions are tentative. The small number of patients reduced the power of the correlation analyses, and high coefficient values were needed to attain statistical significance. Although statistically significant relationships are likely to be more robust and meaningful in this circumstance, the possible presence of less robust relationships can be neither confirmed nor excluded. The small sample size and heterogeneity in age, education, and duration of dementia also limit the applicability of our results to another group of patients with AD. The small sample prohibits inclusion in the analytic models of many independent variables to account for the group's heterogeneity.
Patients with extensive subcortical pathology were excluded to satisfy NINCDS-ADRDA criteria for probable AD.
24 This criterion may have resulted in type II errors by reducing the variance of subcortical pathology and the likelihood of finding statistically significant results for relationships that truly exist. However, including patients with more extensive subcortical pathology might have reduced the diagnostic specificity of our study group. In measuring the severity of subcortical hyperintensities for each patient, we combined scores measuring periventricular and deep white matter hyperintensities into a single score, thereby making the assumption that the effects of these lesions on the factors of interest are equal for a given score and are additive. Although each lesion type has been shown to be related to the same risk factors for dementia,
9 our assumption lacks the support of further evidence. Finally, statistical methodology did not include correction for multiple comparisons because of the exploratory nature of this study and interest in reducing the likelihood of type II as well as type I error.
In summary, this study indicates that anterior subcortical MRI hyperintensities influence relative frontal–parietal metabolic activity in patients with AD, but no direct effect of local SH on absolute regional cortical metabolism is apparent. Subcortical hyperintensities do not appear to have marked effects on individual clinical symptoms, although total neuropsychiatric symptoms may reflect regional subcortical pathology. Complex and overlapping neural networks involved in brain processes and behavior make the role of subcortical MRI hyperintensities in AD challenging to elucidate, but results from this study indicate that these lesions may play a pathophysiologic role in AD.


