Abstract

Objective:

Although several lines of evidence implicate gray matter abnormalities in the prefrontal cortex and anterior cingulate cortex in patients with bipolar disorder, findings have been largely inconsistent across studies. Differences in patients' medication status or mood state or the application of traditional volumetric methods that are insensitive to subtle neuroanatomical differences may have contributed to variations in findings. The authors used MRI in conjunction with cortical pattern matching methods to assess cortical thickness abnormalities in euthymic bipolar patients who were not receiving lithium treatment.

Method:

Thirty-four lithium-free euthymic patients with bipolar I disorder and 31 healthy comparison subjects underwent MRI scanning. Data were processed to measure cortical gray matter thickness. Thickness maps were spatially normalized using cortical pattern matching and were analyzed to assess illness effects and associations with clinical variables.

Results:

Relative to healthy comparison subjects, euthymic bipolar patients had significantly thinner gray matter in the left and right prefrontal cortex (Brodmann's areas 11, 10, 8, and 44) and the left anterior cingulate cortex (Brodmann's areas 24/32). Thinning in these regions was more pronounced in patients with a history of psychosis. No areas of thicker cortex were detected in bipolar patients relative to healthy comparison subjects.

Conclusions:

Using a technique that is highly sensitive to subtle neuroanatomical differences, significant regional cortical thinning was found in lithium-free euthymic patients with bipolar disorder.
Bipolar disorder affects 1.5%–3% of the population (1), yet the neurophysiologic basis for the disorder remains unknown. Structural neuroimaging studies using region-of-interest-based techniques have reported that bipolar patients exhibit volumetric reductions in gray matter subregions of the frontal lobe, including the left subgenual (2, 3), the left dorsomedial (4), the left and right inferior and middle prefrontal (4, 5), and the left and right anterior cingulate cortices (6). However, other region-of-interest-based studies of bipolar disorder have reported greater volumes (7) or no difference (8) in these regions relative to healthy volunteers. Studies using methods that compare gray matter on a point-by-point basis, such as voxel-based morphometry, have found similar gray matter deficits in the left subgenual (9), the left middle (9) and the left and right inferior prefrontal (10), and the left anterior cingulate cortices (10). Yet other voxel-based morphometry studies have found either no difference in frontal regions (11, 12) or a greater volume of gray matter in patients relative to healthy volunteers (13).
Among the possible causes for these inconsistencies is the heterogeneity of patient samples. Most studies have included patients being treated with lithium, a medication associated with increases in cortical and subcortical gray matter volumes (1416). Most studies have also included patients in various mood states at the time of scanning, despite recent evidence demonstrating volume reductions in depressed compared with euthymic bipolar patients (8, 17). A majority of studies additionally have not controlled for the wide variations in gyral patterning that naturally exist between individuals and may cause errors in registration and subsequent morphometric analyses (18).
Given these issues, we sought to examine cortical thickness abnormalities using surface-based brain mapping methods in a sample of euthymic, lithium-free bipolar I patients. We used a specialized registration procedure known as cortical pattern matching, which improves on traditional registration approaches by aligning structural or functional MR images across subjects using sulcal features. Through explicit identification of sulcal landmarks and use of these landmarks as anchors in a warping process, cortical pattern matching achieves an overlapping sulcal alignment across subjects. This matching of sulcal anatomy eliminates much of the confounding anatomical variance when pooling data and significantly boosts statistical power, making it easier to identify and localize subtle differences in brain structure between groups (19). Based on previous structural neuroimaging studies and studies of neurocognitive function (4, 9), we hypothesized that lithium-free, euthymic bipolar patients would have reduced gray matter thickness in the prefrontal cortex and anterior cingulate cortex relative to healthy comparison subjects.

Method

Participants

The study was approved by the UCLA and VA Greater Los Angeles Healthcare System institutional review boards, and each participant provided written informed consent. Patients with bipolar I disorder were recruited through the outpatient UCLA Mood Disorders Clinic and the outpatient Bipolar Disorders Clinic of the VA Greater Los Angeles Healthcare System. Healthy volunteers were recruited by advertisement in local newspapers and campus flyers. Exclusion criteria for both groups included left-handedness, hypertension, neurologic illness, metal implants, and a history of skull fracture or head trauma with loss of consciousness exceeding 5 minutes.
All potential participants were evaluated using the Structured Clinical Interview for DSM-IV (SCID) to confirm bipolar disorder in the bipolar group and absence of psychiatric diagnoses in the comparison group. Healthy volunteers were excluded if they had current or past psychiatric diagnoses (including substance abuse) or currently used psychiatric medication. Bipolar patients who had other active axis I disorders or had used lithium during the month before scanning were excluded. History of psychosis was assessed using the SCID. Only euthymic bipolar patients were included in the study. Euthymia was defined as not meeting criteria for a current manic, hypomanic, or depressive mood episode for the past month as assessed by the SCID. Additionally, a score <7 on the Young Mania Rating Scale (YMRS) (20) and a score <7 on the 21-item Hamilton Depression Rating Scale (HAM-D) (21) on the day of scanning were required for inclusion in the study.
Information about patients' prior course of illness and prior and current medication use was obtained by self-report, by reference to medical records when available, and by corroboration of family members or significant others when available and permitted by patients. None of the patients were taking lithium at the time of scanning; only eight (27%) had taken lithium in the past. Twenty-four patients were taking other medications, and 10 were taking no medications at the time of scanning.

Data Acquisition

Contiguous sagittal high-resolution three-dimensional magnetization-prepared rapid gradient echo T1-weighted images were obtained using a 1.5-T Siemens Sonata MRI scanner at the UCLA Ahmanson-Lovelace Brain Mapping Center (160 slices; field of view=256 mm; isotropic voxel size=1 mm3; repetition time=1,900 msec; echo time=4.38 msec; flip angle=15°; averages=4; total scan time=8.14 minutes).

Data Analysis

Demographic variables

Statistical analysis of demographic variables was performed using the R software package (http://www.r-project.org). Group differences in categorical and continuous demographic variables were assessed using two-tailed Fisher's exact and independent t tests, respectively. Alpha was set at 0.05.

Image data

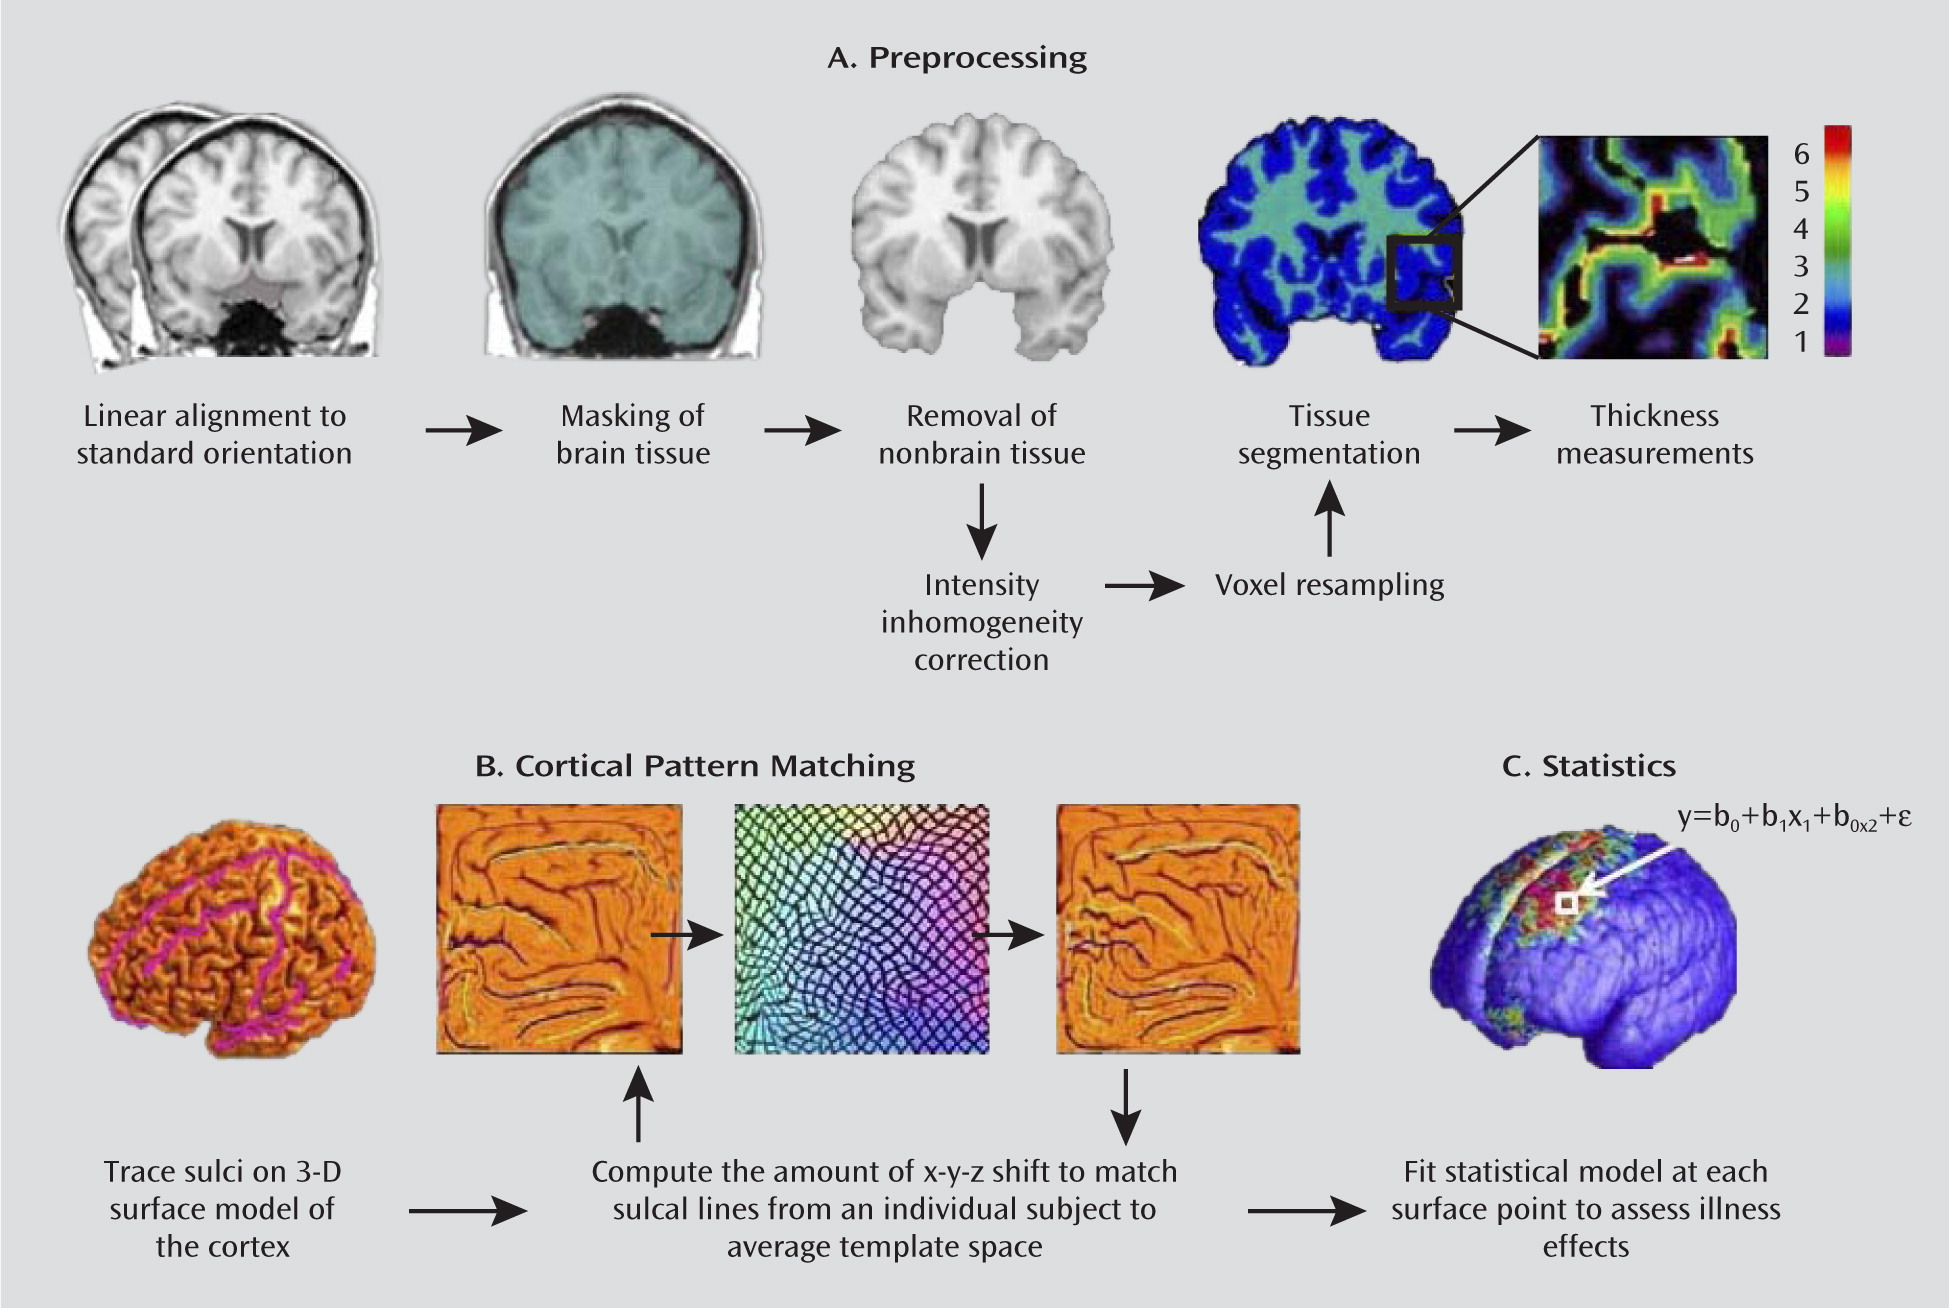
MR images were processed on a Silicon Graphics Reality Monster supercomputer by an image analyst (L.C.F.R.) who was blind to participant information, using a series of manual and automated procedures that are described below and summarized in Figure 1.
FIGURE 1. Processing of MRI Scans to Assess Cortical Thickness in Patients With Bipolar I Disorder and Healthy Comparison Subjectsa
a Panel A shows the steps required to derive cortical thickness maps from each participant's MR image volume (for details, see the Data Analysis section). In panel B, cortical pattern matching is used to align cortical features across participants to bring cortical thickness maps into correspondence; this procedure involves the flattening of individual cortical surfaces for alignment with a group average sulcal pattern. In panel C, once individual cortical surfaces are aligned to the mean template, group differences in gray matter thickness are mapped at each cortical surface point. Figure adapted from Thompson et al. (19).

Image preprocessing

Image preprocessing steps consisted of 1) adjustment for head position and transformation of data into a common stereotaxic coordinate system without scaling (http://www.bic.mni.mcgill.ca/software); 2) automated exclusion of cerebellum and nonbrain tissue (22); 3) correction of artifactual intensity nonuniformities (23); 4) resampling at 0.33-mm3 voxels to allow estimation of cortical thickness with subvoxel accuracy; and 5) automatic classification of voxels into gray matter, white matter, and CSF using a partial volume classification method (22).

Analysis of whole brain and segmented tissue volumes

Total brain volume was calculated from preprocessed MRI volumes. Total gray and white matter volume were calculated from segmented MRI volumes. Diagnosis effects on gray matter volume and white matter volume were examined in R using multiple regression, controlling for age, gender, and total brain volume. Diagnosis effects on total brain volume were examined controlling for age and gender.

Measurement of cortical gray matter thickness

Prior to registration using cortical pattern matching, cortical thickness was computed separately for each participant. Thickness was defined as the shortest three-dimensional distance from the cortical white-gray matter boundary to the hemispheric surface without crossing voxels classified as CSF. The three-dimensional eikonal equation (19) was applied to voxels segmenting as gray matter to compute this distance (in millimeters) in a fully automated manner at each point along the cortical surface. Because we expected to find group differences in thickness at approximately the size of a gyrus or larger, we used a uniform spatial filter of a radius of 15 mm. These methods have been shown to produce thickness measurements that agree with those found in postmortem samples (24, 25) and are stable over time in validation studies using short-interval repeat scanning of multiple subjects (25).

Cortical pattern matching procedure

After image preprocessing, each participant's scan was processed to create a three-dimensional surface model of the cortex using automated software that deforms a spherical mesh surface to fit cortical surface tissue using a threshold intensity value that differentiates extracortical CSF from brain tissue (26). Thirty-one separate sulci were then manually delineated on each participant's surface model. Sulcal tracing was performed by a trained researcher (J.K.S.) who was blind to participant characteristics, using the MNI-Display software package (http://www.bic.mni.mcgill.ca/software) with a previously validated surface-based anatomical protocol (25). Tracer reliability was measured using the three-dimensional root mean square difference (in millimeters) between sulci in a set of six test brains and those of a gold standard set. Disparities between the test and gold standard brains were computed to be <2 mm for all landmarks.
Warping algorithms computed the amount of shift in the x, y, and z directions needed to explicitly match each sulcus in each participant to that of the average anatomical study template generated from patients and healthy comparison subjects combined (19). Cortical pattern matching algorithms were used to associate the same parameter space coordinates across participants, without actually warping cortical surface models. This process reparameterized individual cortical models so that corresponding anatomy across participants bore the same coordinate locations.

Group differences in cortical thickness.

After alignment of individual participant thickness maps using cortical pattern matching procedures, statistical analyses were performed at each cortical surface point to assess group differences in gray matter thickness using R. Between-group (healthy comparison subjects relative to bipolar patients) differences in cortical gray matter thickness were determined using a general linear model at each of 65,536 points across the cortical surface while controlling for age, gender, and total brain volume. Statistics from this analysis were mapped as uncorrected color-coded p values to provide a visual representation of illness effects. The maps were corrected for multiple comparisons using the procedures described below.
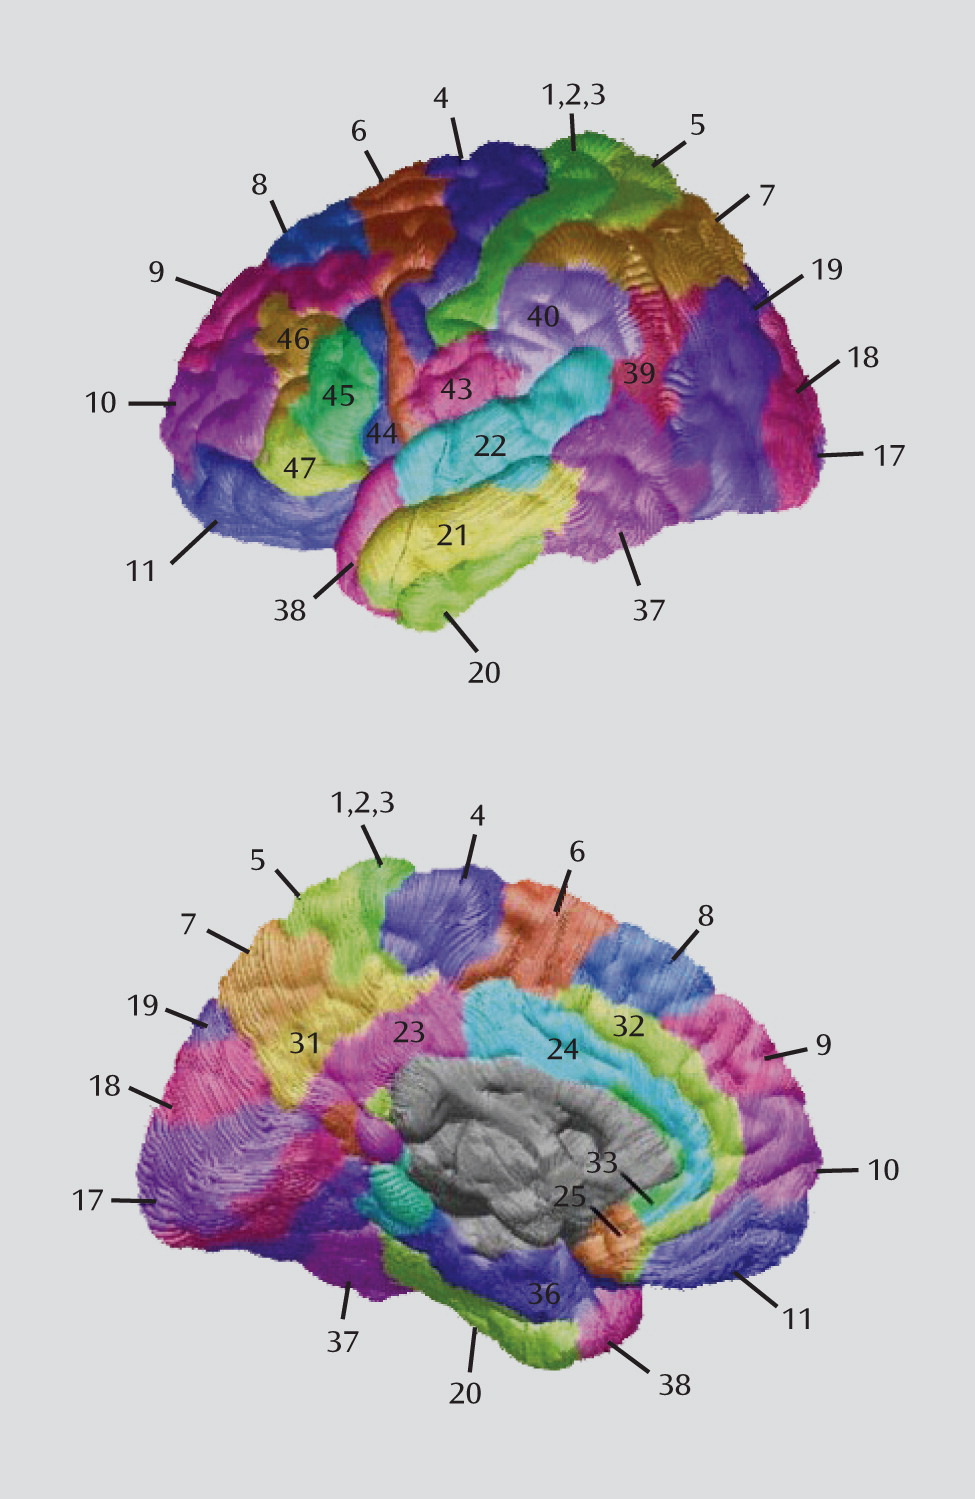
Based on our strong a priori hypotheses regarding specific brain regions that might be affected in bipolar illness, we assessed thickness in two regions, the prefrontal cortex and the anterior cingulate cortex. The anatomical boundaries for each of the two regions of interest have been defined previously (14). Briefly, the prefrontal cortex contained all cortical gray matter anterior to the precentral sulcus and superior and anterior to the cingulate sulcus. The anterior cingulate cortex contained all cortical gray matter anterior to the paracentral sulcus, inferior to the cingulate sulcus, and posterior to the pericallosal sulcus. Exploratory follow-up analyses were also conducted to determine which subregions of the prefrontal and anterior cingulate cortex were driving any overall significant findings. These smaller subregions were positioned within the broader prefrontal cortex and anterior cingulate regions of interest and defined using Brodmann's areas that were deformed to the study-specific average anatomical template using the Deformable Brodmann Area Atlas (27) (Figure 2).
FIGURE 2. Brodmann's Areas Deformed to the Average Anatomical Template Using the Deformable Brodmann Area Atlasa
a See reference 27.
For these and all other thickness analyses, correction for multiple comparisons (arising from fitting a separate model at each surface point within each region) was performed using permutation testing (19). This method randomly permutes group membership 1,000,000 times to measure the distribution of features in the statistical maps that would be observed by accident. This resulted in a single p value for each region of interest that was corrected for multiple comparisons across surface points contained within that region. A two-tailed alpha of 0.05 was set as the threshold for statistical significance. Given that our primary hypotheses were limited to two brain regions, and given that the follow-up subregional (Brodmann's area) analyses were exploratory in nature, no additional correction was made for the number of regions tested.

Association of cortical thickness with course-of-illness variables

Pointwise associations between gray matter thickness and continuous course-of-illness variables were explored using partial correlation analyses. Gender and total brain volume were included as covariates in analyses of course-of-illness variables that were highly collinear with age, such as illness duration (r=0.82, p<0.0001). All other analyses controlled for gender, total brain volume, and age. Correlations were screened for within search regions defined by areas showing a significant group difference in the analysis of diagnosis effects in the prefrontal cortex and anterior cingulate cortex.

Examination of history of psychosis effects on cortical thickness

To examine whether a history of psychosis was associated with alterations in cortical gray matter, patients with and without a history of psychosis were compared using multiple linear regression at each cortical surface point, controlling for age, gender, and total brain volume.

Results

A total of 34 currently euthymic patients with bipolar I disorder (13 of them female; mean age=38.1 years [SD=12.0]) and 31 healthy comparison subjects (13 of them female; mean age=37.8 years [SD=13.1]) were included in the study. Table 1 summarizes participants' demographic and clinical characteristics. Bipolar patients did not differ significantly from comparison subjects in age, gender, handedness, educational level, or race. On the day of the scan, bipolar patients' average HAM-D and YMRS scores were 4.5 (SD=2.3) and 1.7 (SD=2.2), respectively. Seventeen (50%) of the bipolar patients had experienced psychotic symptoms during manic or depressive episodes, as determined during SCID interviews, and were classified as having a history of psychosis.
TABLE 1. Demographic and Clinical Characteristics of Patients With Bipolar I Disorder and Healthy Comparison Subjects in a Study of Cortical Thickness
 Group
CharacteristicBipolar Patients (N=34)Comparison Subjects (N=31)
 MeanSDMeanSD
Age (years)38.112.037.813.1
Education levela3.00.63.20.6
Hamilton Depression Rating Scale score4.52.3  
Young Mania Rating Scale score1.72.2  
Duration of illness (years)19.812.5  
Age at illness onset (years)18.27.5  
Previous manic episodes7.711.6  
Previous depressive episodes8.411.0  
Hospitalizations2.62.7  
Hospitalizations for mania1.71.7  
Hospitalizations for depression0.91.3  
Interval between diagnosis and first medication treatment (years)8.59.9  
 N%N%
Female13381342
Race    
    Caucasian25732167
    Asian26723
    African American618310
    Other1300
History of psychosis1750  
Medicationsb    
    Unmedicated1029  
    Lithium00  
    Anticonvulsants1853  
    Antipsychotics1750  
    Antidepressants926  
    Benzodiazepines13  
a
Rated on a 4-point scale: 1=grade 8 or less; 2=grades 9–12; 3=1–4 years of college or university; 4=5 or more years of college or university.
b
Anticonvulsants were divalproex sodium (N=5), lamotrigine (N=10), oxcarbazepine (N=1), and carbamazepine (N=2). Antipsychotics were aripiprazole (N=8), risperidone (N=1), ziprasidone (N=1), olanzapine (N=3), and quetiapine (N=4). Antidepressants were paroxetine (N=1), fluoxetine (N=2), citalopram (N=1), escitalopram (N=1), venlafaxine (N=1), bupropion (N=2), and trazodone (N=1). Benzodiazepine was temazepam (N=1).

Whole Brain Tissue Volumes

Multiple regression analyses revealed no significant effects of diagnosis on cortical tissue volumes, including total brain volume, gray matter volume, and white matter volume.

Cortical Gray Matter Thickness

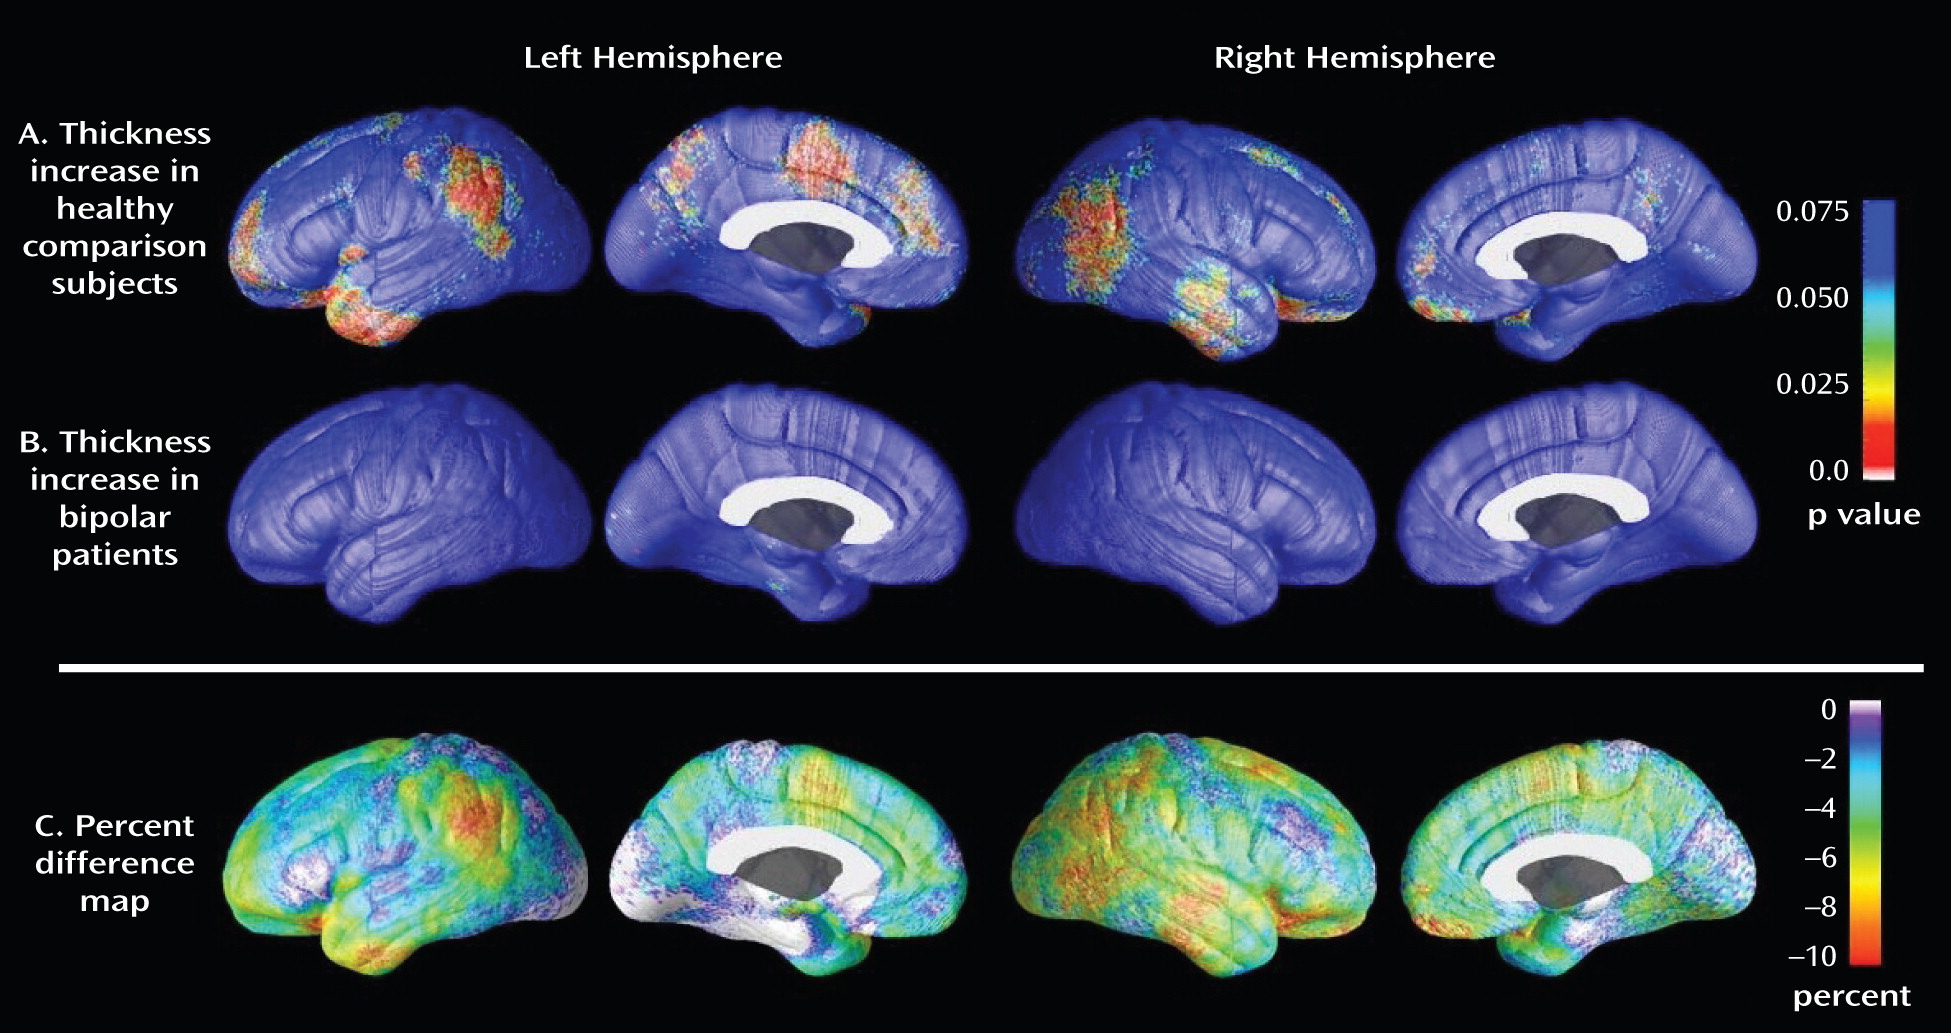
Pointwise analysis of cortical gray matter thickness, controlling for age, gender, and total brain volume, revealed significant effects of diagnosis across widespread areas of the cortex. Spatial patterns of regional thinning in patients relative to healthy comparison subjects are mapped onto the three-dimensional group averaged hemispheric surface model as uncorrected p values (Figure 3). These uncorrected two-tailed probability maps are thresholded at a p value of 0.05, with more significant regions encoded by corresponding color bars. Regional corrected p values, obtained using permutation methods described above, are listed in Table 2. Permutation testing results revealed a significant effect of diagnosis in the prefrontal cortex bilaterally (left: F=6.88, df=1, 60, p=0.011; right: F=4.41, df=1, 60, p=0.040) and in the left anterior cingulate cortex (F=5.53, df=1, 60, p=0.022). Within the prefrontal cortex, permutation testing revealed that cortical thinning in patients was localized to the orbital cortex bilaterally (Brodmann's area 11; F=8.12, df=1, 60, p=0.006), the left dorsomedial cortex (Brodmann's area 8; F=4.15, df=1, 60, p=0.046), the left ventrolateral cortex (Brodmann's area 44; F=4.50, df=1, 60, p=0.038), and the left frontopolar cortex (Brodmann's area 10; F=5.62, df=1, 60, p=0.021). Within the anterior cingulate cortex, permutation testing showed that thinning was localized to the left anterior cingulate cortex (Brodmann's area 24; F=7.08, df=1, 60, p=0.010) and the left pericingulate cortex (Brodmann's area 32; F=6.14, df=1, 60, p=0.016). No areas of thicker cortex were detected in patients relative to healthy comparison subjects. While these subregional analyses were intended as exploratory, several of the results would survive an additional correction for multiple comparisons. A Bonferroni correction for the eight Brodmann's areas within the prefrontal cortex would reduce the significance threshold from 0.05 to 0.00625 (0.05/8), a standard that is met by thinning in the orbitofrontal cortex bilaterally (Brodmann's area 11; p=0.006). Similarly, thinning in the left anterior cingulate (Brodmann's area 24; p=0.0100) would survive a correction to 0.0125 (0.05/4) for the four Brodmann's areas contained within this area.
FIGURE 3. Cortical Thickness Maps Showing Gray Matter Differences Between Patients With Bipolar I Disorder and Healthy Comparison Subjectsa
a Decreased thickness (panel A) and increased thickness (panel B) in bipolar patients (N=34) relative to healthy comparison subjects (N=31). Percent difference maps (panel C) show the magnitude of cortical thickness reductions in patients. Probability maps show thresholded, uncorrected p values in color for areas showing a regional cortical thickness difference between groups. Corrected p values are presented in Table 2.
TABLE 2. Frontal Lobe Subregions Showing Different Cortical Thickness Between Patients With Bipolar I Disorder and Healthy Comparison Subjects
Cortical RegionHemisphereBrodmann's Areapa
Prefrontal cortex   
    Orbital cortexLeft110.006
 Right110.006
    Frontopolar cortexLeft100.021
    Ventrolateral cortexLeft440.038
    Dorsomedial cortexLeft80.046
 Right80.085 
 Left90.071
Anterior cingulate cortexLeft240.010
 Left320.016
a
Corrected two-tailed significance levels after controlling for age, gender, and total brain volume following permutation testing.
The impact of current medications on cortical thickness was additionally explored through direct pointwise group comparisons between euthymic patients who were (N=24) or were not (N=10) being treated with medication at the time of scanning. These analyses revealed no areas of significant difference.
To examine the influence of prior lithium exposure as a potential confounder of cortical gray matter thickness, analyses were conducted comparing cortical thickness between patients who had (N=8) and who had not (N=22) been clearly documented to have taken lithium in the past. Results from this analysis showed no areas of significant group difference in cortical thickness, suggesting that prior lithium use itself was not a significant confounder.

Association With Prior Course of Illness

Within patients, thickness in the left hemisphere was negatively associated with duration of illness (Brodmann's areas 24, 43, and 8; F≥4.17, df=1, 30, p≤0.05), interval between illness onset and initiation of medication treatment (Brodmann's areas 24, 32, and 8; F≥4.17, df=1, 30, p≤0.05), and prior number of depressive episodes (Brodmann's areas 8, 10, and 11; F≥4.17, df=1, 30, p≤ 0.03). However, because age shared a high collinearity with these variables, we (like others [28, 29]) could not disentangle course-of-illness effects from the effects of normal aging. Additionally, although no main effect of illness was detected in the subgenual region of the left prefrontal cortex (Brodmann's area 25), a highly significant positive association was detected in this region between thickness and number of hospitalizations for mania (F=5.21, df=1, 29, p=0.030).

Association With Psychosis

Patients with a history of psychosis, relative to those without, demonstrated significantly greater thinning in the left ventrolateral prefrontal cortex (Brodmann's area 44; F=4.57, df=1, 29, p=0.041), the left dorsomedial prefrontal cortex (Brodmann's area 8; F=4.22, df=1, 29, p=0.049), and the left temporal pole (Brodmann's area 38; F=8.43, df=1, 29, p=0.007).

Discussion

Using cortical matching methods in conjunction with tools for measuring gray matter thickness, we found significant thinning in the left and right prefrontal and the left anterior cingulate cortices in euthymic bipolar patients relative to healthy comparison subjects. Within these regions, thinning was localized to specific subregions, including the left and right orbital cortex (Brodmann's area 11), the left frontopolar cortex (Brodmann's area 10), the left dorsomedial cortex (Brodmann's area 8), the left ventrolateral prefrontal cortex (Brodmann's area 44), the left anterior cingulate cortex (Brodmann's area 24), and the left pericingulate cortex (Brodmann's area 32).
To our knowledge, only two previous studies have examined brain structure in recurrently ill adult patients with bipolar disorder using cortical thickness methods in conjunction with MRI. Lyoo et al. (29) reported thinning of prefrontal cortical gray matter in 25 bipolar patients relative to 21 healthy comparison subjects in left Brodmann's areas 46, 24, and 32 and right Brodmann's area 10. In a region-of-interest-driven study, Fornito et al. (6) found thinning in left Brodmann's area 24 and right Brodmann's area 32 in 24 patients relative to 24 healthy comparison subjects. In the present study, which used a larger sample of 34 patients and 31 healthy comparison subjects, cortical pattern matching methods were used to allow a more precise mapping of thickness abnormalities in bipolar disorder (30, 31). These methods improve on the traditional registration approaches by using sulcal features to align corresponding anatomy across participants, eliminating much of the confounding anatomical variance when pooling data across participants, thereby making it easier to identify and localize subtle group differences in brain structure (19). Using this highly sensitive technique, we replicated and extended the above prior study findings.
This study has several unique strengths. First, unlike a majority of previous studies, which either did not specify current medication treatment (32) or included a number of patients who were receiving treatment with lithium at the time of scanning (4, 8, 10, 12, 29), all participants in our patient sample were free of current treatment with this medication. This aspect of the study may be particularly important given recent evidence showing that lithium treatment is associated with significant increases in cortical gray matter. Moore et al. (33) found that total gray matter volume increased by 3%, on average, in bipolar patients after 4 weeks of lithium treatment. Sassi et al. (16, 34) found larger total gray matter volume in lithium-treated bipolar patients compared with both untreated patients and healthy comparison subjects. Bearden et al. (14) found that prefrontal cortical gray matter density was greater in bipolar patients treated with lithium relative to both healthy comparison subjects and bipolar patients not treated with lithium. Our group has also found lithium-associated gray matter enlargement of subcortical structures in bipolar patients (15). Use of lithium, therefore, may serve to explain why some previous structural neuroimaging studies of bipolar disorder have either failed to detect gray matter reductions in patients (11) or found group differences in the opposite direction (i.e., larger gray matter volumes in bipolar patients relative to healthy comparison subjects) (7, 12, 13).
A second strength of this study is that all participants in our bipolar group were in the same mood state (euthymia) at the time of scanning. Although previous studies have not controlled for this factor, recent data from our group (17) and others (8) suggest that mood state may affect MRI results. Brooks et al. (17) found that depressed bipolar patients exhibited lower gray matter density in the dorsal prefrontal cortices relative to euthymic bipolar patients. Nery et al. (8) also found gray matter reductions in the orbitofrontal cortex of depressed relative to euthymic bipolar patients. A similar pattern of gray matter volume reductions was found more recently by our group in patients scanned longitudinally (in different mood states) as well (35a).
A third strength of our study is that all participants in the patient group had diagnoses of bipolar I disorder. Whether bipolar subtype is associated with distinct cortical abnormalities is not known, but subtype could contribute to the heterogeneity of structural neuroimaging findings. Only one study (35), to our knowledge, has specifically examined the impact of bipolar subtype on brain structure. In that study, unmedicated patients with bipolar I disorder were found to exhibit smaller volumes of the left amygdala compared with unmedicated patients with bipolar II disorder. This finding, as well as data from studies that show bipolar I disorder to be associated with greater neuropsychological impairment (36), a higher risk for psychosis, and more severe manias than bipolar II disorder, suggests that bipolar subtype could be associated with distinct patterns of thinning in cortical gray matter. Studies that directly compare cortical gray matter in patients with bipolar I and bipolar II disorder are needed to more thoroughly examine this issue.
With these efforts to study a more homogeneous bipolar population and to control for some known confounders, we found reduced thickness in the prefrontal and anterior cingulate cortices of patients with bipolar disorder. The etiology of this thinning remains to be elucidated. One possibility is that reduced thickness in the prefrontal and anterior cingulate cortex of bipolar patients is the result of an underlying neurodegenerative process associated with possible toxic effects of mood episodes. In line with this, and consistent with previous studies (28, 29, 37), we found significant widespread negative associations between cortical thickness and previous course of illness. Although it is tempting to speculate that decreased cortical thickness in patients is causally associated with greater illness duration and a higher number of previous depressive episodes, because these variables were highly correlated with age, we could not disentangle these effects. Studies that sample from bipolar patient groups with a narrow age range but a wide range in the number of previous depressive episodes or other course-of-illness measures are needed to tease apart these factors.
Another possibility is that reduced cortical thickness is present early in the course of the disorder, possibly prior to illness onset, and that such thinning alters normal inhibitory cortico-limbic networks, resulting in an increased vulnerability to emotion dysregulation. Data to support this hypothesis come from studies finding gray matter abnormalities in the prefrontal cortex of unaffected relatives of individuals with bipolar and unipolar depressive disorders (38, 39). Whether these individuals with cortical thinning go on to develop the disorder is unclear, however, and longitudinal studies that more thoroughly explore the relation between cortical thinning and illness onset would be of interest.
Thinning of the prefrontal and anterior cingulate cortices could contribute to some of the behavioral changes that are observed in bipolar disorder. Lesion studies show that focal damage to the orbitofrontal cortex is associated with a diminished ability to properly gauge the positive or negative emotional consequences of one's actions (40), and damage to the anterior cingulate cortex results in symptoms that include inattention and emotional instability (41, 42). At least one functional neuroimaging study (43) has reported activation in both the orbitofrontal and anterior cingulate cortices in healthy volunteers during the conscious regulation of negative emotional states. This same study found that activation in the orbitofrontal cortex was negatively correlated with activation in the amygdala, suggesting an inhibitory connection between these regions. Other studies involving emotion regulatory paradigms, however, have found frontal activation (and corresponding negative correlations with amygdala activation) to be localized to the lateral portion of prefrontal cortex (e.g., Brodmann's area 47) (4446). Although thinning in this ventrolateral region was not observed in patients in the present study, it is well established that robust structural connections run between the lateral (e.g., Brodmann's area 47) and medial (e.g., Brodmann's area 11) sectors of the orbitofrontal cortex, but that only the medial subdivision sends direct inhibitory projections to the amygdala (47, 48). The lateral sector of the orbitofrontal cortex therefore may suppress amygdala output via intermediary projections from the medial orbitofrontal cortex. Thus, it is interesting that our group has observed increased activation of the amygdala and decreased activation of the lateral orbitofrontal cortex (44, 49, 50) and thinning in the medial (but not lateral) orbitofrontal cortex. The data in this study could therefore provide a structural etiology for the functional abnormalities previously observed by our group. Additional studies examining the relation between brain structure and function in emotion regulatory circuits are currently under way in our laboratory.
With the exception of thinning in the orbitofrontal cortex, which was bilateral, most of the thinning observed in patients in the present study was localized to the left hemisphere. This hemispheric pattern agrees with previous studies; of the four that have reported abnormal structure of the anterior cingulate (i.e., Brodmann's area 24/32), three (10, 29, 51) found deficits in the left hemisphere only, one (6) found deficits in the anterior cingulate bilaterally, and none found deficits that were restricted to the right hemisphere. The reason for this laterality is not known, although the concept of hemispheric lateralization of mood regulation is well documented. Current models of emotional processing suggest that positive (or approach-related) emotions are lateralized toward the left hemisphere, whereas negative (or withdrawal-related) emotions are lateralized toward the right hemisphere (52). Lesions to the left prefrontal cortex, for example, have been associated with an increased risk for depressive symptoms (53).
In addition to the negative associations observed here between cortical thickness and illness duration and number of previous depressive episodes, two other findings require further investigation. First, thickness in the left subgenual prefrontal cortex was positively associated with the number of past hospitalizations for mania, a finding that remained significant when age was controlled for in our statistical model. It is possible, given recent evidence suggesting that mood state may affect brain structure (8, 17), that the manic state itself, particularly when severe enough to require hospitalization, has enduring hypertrophic effects on gray matter. Additional research, however, is needed to address this possibility. Second, a history of psychosis in bipolar patients was associated with significantly greater thinning in the left ventrolateral prefrontal cortex (Brodmann's area 44), the left dorsomedial prefrontal cortex (Brodmann's area 8), and the left temporal pole (Brodmann's area 38). More pronounced thinning in these regions may suggest that psychotic and nonpsychotic forms of bipolar disorder are characterized by distinct patterns of gray matter abnormalities. This pattern of deficit is congruent with neurocognitive studies that show bipolar patients with a history of psychosis to be impaired on some prefrontal functions, such as executive functioning and spatial working memory, compared with bipolar patients without such a history (54). Moreover, studies of patients with chronic schizophrenia (55, 56) and psychosis (57, 58) consistently show gray matter reductions in the left dorsomedial region of the prefrontal cortex (Brodmann's area 8). Cortical gray matter loss in this region therefore may be associated with psychosis in particular. In the bipolar patients in the present study, however, unlike in patients with schizophrenia, cortical gray matter in the dorsolateral prefrontal cortex (e.g., Brodmann's area 46) was relatively spared. Thus, distinct and identifiable patterns of neuroanatomical pathology could potentially distinguish these two disorders. However, additional studies are needed to more accurately address this possibility.
Our study has several limitations. First, many of our patients were taking other medications, of which the long- and short-term effects on brain structure are not known. Our comparisons of cortical thickness between medicated and unmedicated patients, however, showed no evidence of a significant effect of this factor. Second, some patients reported taking lithium in the years prior to scanning, and past exposure to this medication could have affected our results. As lithium increases gray matter volume (33), however, it would be expected that any enduring hypertrophic effects of past treatment with this medication would have produced group differences opposite to those observed here. Additionally, comparisons between patients who had and had not previously taken lithium indicate that prior lithium use itself was not a significant confounder.
Footnote

Received June 24, 2010; revision received Oct. 7, 2010; accepted Oct. 29, 2010.

References

1.
Angst J: The emerging epidemiology of hypomania and bipolar II disorder. J Affect Disord 1998; 50:143–151
2.
Hirayasu Y, Shenton ME, Salisbury DF, Kwon JS, Wible CG, Fischer IA, Yurgelun-Todd D, Zarate C, Kikinis R, Jolesz FA, McCarley RW: Subgenual cingulate cortex volume in first-episode psychosis. Am J Psychiatry 1999; 156:1091–1093
3.
Drevets W, Price J, Simpson J, Todd R, Reich T, Vannier M, Raichle M: Subgenual prefrontal cortex abnormalities in mood disorders. Nature 1997; 386:824–827
4.
Lopez-Larson M, DelBello M, Zimmerman M, Schwiers M, Strakowski S: Regional prefrontal gray and white matter abnormalities in bipolar disorder. Biol Psychiatry 2002; 52:93–100
5.
Frangou S: The Maudsley Bipolar Disorder Project. Epilepsia 2005; 46:19–25
6.
Fornito A, Malhi GS, Lagopoulos J, Ivanovski B, Wood SJ, Saling MM, Pantelis C, Yücel M: Anatomical abnormalities of the anterior cingulate and paracingulate cortex in patients with bipolar I disorder. Psychiatry Res 2008; 162:123–132
7.
Javadapour A, Malhi GS, Ivanovski B, Chen X, Wen W, Sachdev P: Increased anterior cingulate cortex volume in bipolar I disorder. Aust NZ J Psychiatry 2007; 41:910–916
8.
Nery FG, Chen HH, Hatch JP, Nicoletti MA, Brambilla P, Sassi RB, Mallinger AG, Keshavan MS, Soares JC: Orbitofrontal cortex gray matter volumes in bipolar disorder patients: a region-of-interest MRI study. Bipolar Disord 2009; 11:145–153
9.
Frangou S, Hadjulis M, Chitnis X, Baxter D, Donaldson S, Raymont V: The Maudsley Bipolar Disorder Project: brain structural changes in bipolar I disorder. Bipolar Disord 2002; 4:123–124
10.
Lyoo IK, Kim MJ, Stoll AL, Demopulos CM, Parow AM, Dager SR, Friedman SD, Dunner DL, Renshaw PF: Frontal lobe gray matter density decreases in bipolar I disorder. Biol Psychiatry 2004; 55:648–651
11.
Scherk H, Kemmer C, Usher J, Reith W, Falkai P, Gruber O: No change to grey and white matter volumes in bipolar I disorder patients. Eur Arch Psychiatry Clin Neurosci 2008; 258:345–349
12.
Chen X, Wen W, Malhi GS, Ivanovski B, Sachdev PS: Regional gray matter changes in bipolar disorder: a voxel-based morphometric study. Aust NZ J Psychiatry 2007; 41:327–336
13.
Adler CM, Levine AD, DelBello MP, Strakowski SM: Changes in gray matter volume in patients with bipolar disorder. Biol Psychiatry 2005; 58:151–157
14.
Bearden CE, Thompson PM, Dalwani M, Hayashi KM, Lee AD, Nicoletti M, Trakhtenbroit M, Glahn DC, Brambilla P, Sassi RB, Mallinger AG, Frank E, Kupfer DJ, Soares JC: Greater cortical gray matter density in lithium-treated patients with bipolar disorder. Biol Psychiatry 2007; 62:7–16
15.
Foland LC, Altshuler LL, Sugar CA, Lee AD, Leow AD, Townsend J, Narr KL, Asuncion DM, Toga AW, Thompson PM: Increased volume of the amygdala and hippocampus in bipolar patients treated with lithium. Neuroreport 2008; 19:221–224
16.
Sassi RB, Nicoletti M, Brambilla P, Mallinger AG, Frank E, Kupfer DJ, Keshavan MS, Soares JC: Increased gray matter volume in lithium-treated bipolar disorder patients. Neurosci Lett 2002; 329:243–245
17.
Brooks JO, Bonner JC, Rosen AC, Wang PW, Hoblyn JC, Hill SJ, Ketter TA: Dorsolateral and dorsomedial prefrontal gray matter density changes associated with bipolar depression. Psychiatry Res 2009; 172:200–204
18.
Thompson P, Woods R, Mega M, Toga A: Mathematical/computational challenges in creating deformable and probabilistic atlases of the human brain. Human Brain Mapp 2000; 9:81–92
19.
Thompson PM, Hayashi KM, Sowell ER, Gogtay N, Giedd JN, Rapoport JL, de Zubicaray GI, Janke AL, Rose SE, Semple J, Doddrell DM, Wang Y, van Erp TG, Cannon TD, Toga AW: Mapping cortical change in Alzheimer's disease, brain development, and schizophrenia. Neuroimage 2004; 23:S2–S18
20.
Young RC, Biggs JT, Ziegler VE, Meyer DA: A rating scale for mania: reliability, validity, and sensitivity. Br J Psychiatry 1978; 133:429–435
21.
Hamilton M: A rating scale for depression. J Neurol Neurosurg Psychiatry 1960; 23:56–62
22.
Shattuck D, Leahy R: BrainSuite: an automated cortical surface identification tool. Med Image Anal 2002; 6:129–142
23.
Zijdenbos A, Dawant B: Brain segmentation and white matter lesion detection in MR images. Crit Rev Biomed Eng 1994; 22:401–465
24.
Von Economo C: The Cytoarchitectonics of the Human Cerebral Cortex. London, Oxford Medical Publications, 1929
25.
Sowell ER, Thompson PM, Leonard CM, Welcome SE, Kan E, Toga AW: Longitudinal mapping of cortical thickness and brain growth in normal children. J Neurosci 2004; 24:8223–8231
26.
MacDonald D: A method for identifying geometrically simple surfaces from three dimensional images (doctoral dissertation). Montreal, McGill University, School of Computer Science, 1998
27.
Rasser P, Johnston P, Lagopoulos J, Ward P, Schall U, Thienel R, Bender S, Toga A, Thompson P: A deformable Brodmann area atlas, in Proceedings of the 2004 IEEE International Symposium on Biomedical Imaging. Edited by, Leahy R. New York, IEEE, 2004, pp 400–403
28.
Frey BN, Zunta-Soares GB, Caetano SC, Nicoletti MA, Hatch JP, Brambilla P, Mallinger AG, Soares JC: Illness duration and total brain gray matter in bipolar disorder: evidence for neurodegeneration? Eur Neuropsychopharmacology 2008; 18:717–722
29.
Lyoo IK, Sung YH, Dager SR, Friedman SD, Lee JY, Kim SJ, Kim N, Dunner DL, Renshaw PF: Regional cerebral cortical thinning in bipolar disorder. Bipolar Disord 2006; 8:65–74
30.
Aganj I, Sapiro G, Parikshak N, Madsen SK, Thompson PM: Measurement of cortical thickness from MRI by minimum line integrals on soft-classified tissue. Hum Brain Mapp 2009; 30:3188–3199
31.
Protas HD, Huang SC, Kepe V, Hayashi K, Klunder A, Braskie MN, Ercoli L, Bookheimer S, Thompson PM, Small GW, Barrio JR: FDDNP binding using MR derived cortical surface maps. Neuroimage 2009; 49:240–248
32.
Strakowski SM, DelBello MP, Sax KW, Zimmerman ME, Shear PK, Hawkins JM, Larson ER: Brain magnetic resonance imaging of structural abnormalities in bipolar disorder. Arch Gen Psychiatry 1999; 56:254–260
33.
Moore GJ, Bebchuk JM, Wilds IB, Chen G, Manji HK: Lithium-induced increase in human brain grey matter. Lancet 2000; 356:1241–1242
34.
Sassi RB, Brambilla P, Hatch JP, Nicoletti MA, Mallinger AG, Frank E, Kupfer DJ, Keshavan MS, Soares JC: Reduced left anterior cingulate volumes in untreated bipolar patients. Biol Psychiatry 2004; 56:467–475
35.
Savitz J, Nugent AC, Bogers W, Liu A, Sills R, Luckenbaugh DA, Bain EE, Price JL, Zarate C, Manji HK, Cannon DM, Marrett S, Charney DS, Drevets WC: Amygdala volume in depressed patients with bipolar disorder assessed using high resolution 3T MRI: the impact of medication. Neuroimage 2010; 49:2966–2976
35a.
Brooks JO, Foland-Ross LC, Thompson PM, Altshuler LL: Within-subject changes in gray matter density associated with remission of bipolar depression. Psychiatry Res (in press)
36.
Torrent C, Martínez-Arán A, Daban C, Sánchez-Moreno J, Comes M, Goikolea JM, Salamero M, Vieta E: Cognitive impairment in bipolar II disorder. Br J Psychiatry 2006; 189:254–259
37.
Ekman CJ, Lind J, Rydén E, Ingvar M, Landén M: Manic episodes are associated with grey matter volume reduction: a voxel-based morphometry brain analysis. Acta Psychiatr Scand 2010; 122:507–515
38.
McDonald C, Bullmore ET, Sham PC, Chitnis X, Wickham H, Bramon E, Murray RM: Association of genetic risks for schizophrenia and bipolar disorder with specific and generic brain structural endophenotypes. Arch Gen Psychiatry 2004; 61:974–984
39.
Peterson BS, Warner V, Bansal R, Zhu H, Hao X, Liu J, Durkin K, Adams PB, Wickramaratne P, Weissman MM: Cortical thinning in persons at increased familial risk for major depression. Proc Natl Acad Sci USA 2009; 106:6273–6278
40.
Bechara A, Damasio AR, Damasio H, Anderson SW: Insensitivity to future consequences following damage to human prefrontal cortex. Cognition 1994; 50:7–15
41.
Tow PM, Whitty CW: Personality changes after operation on the cingulate gyrus in man. J Neurol Neurosurg Psychiatry 1953; 16:186–193
42.
Corkin S, Twitchell TE, Sullivan EV: Safety and efficacy of cingulotomy for pain and psychiatric disorder, in Modern Concepts in Psychiatric Surgery. Edited by, Hitchcock ER, Ballantine HT, Myerson BA. New York, Elsevier/North Holland, 1979, pp 253–272
43.
Urry HL, van Reekum CM, Johnstone T, Kalin NH, Thurow ME, Schaefer HS, Jackson CA, Frye CJ, Greischar LL, Alexander AL, Davidson RJ: Amygdala and ventromedial prefrontal cortex are inversely coupled during regulation of negative affect and predict the diurnal pattern of cortisol secretion among older adults. J Neurosci 2006; 26:4415–4425
44.
Foland LC, Altshuler LL, Bookheimer SY, Eisenberger N, Townsend J, Thompson PM: Evidence for deficient modulation of amygdala response by prefrontal cortex in bipolar mania. Psychiatry Res 2008; 162:27–37
45.
Hariri AR, Bookheimer SY, Mazziotta JC: Modulating emotional responses: effects of a neocortical network on the limbic system. Neuroreport 2000; 11:43–48
46.
Lieberman MD, Eisenberger NI, Crockett MJ, Tom SM, Pfeifer JH, Way BM: Putting feelings into words: affect labeling disrupts amygdala activity in response to affective stimuli. Psychol Sci 2007; 18:421–428
47.
Quirk GJ, Likhtik E, Pelletier JG, Paré D: Stimulation of medial prefrontal cortex decreases the responsiveness of central amygdala output neurons. J Neurosci 2003; 23:8800–8807
48.
Amaral DG, Price JL, Pitkänen A, Carmichael ST: Anatomical organization of the primate amygdaloid complex, in The Amygdala: Neurobiological Aspects of Emotion, Memory, and Mental Dysfunction. Edited by, Aggleton JP. New York, Wiley-Liss, 1992, pp1–66
49.
Altshuler L, Bookheimer S, Proenza MA, Townsend J, Sabb F, Firestine A, Bartzokis G, Mintz J, Mazziotta J, Cohen MS: Increased amygdala activation during mania: a functional magnetic resonance imaging study. Am J Psychiatry 2005; 162:1211–1213
50.
Altshuler LL, Bookheimer SY, Townsend J, Proenza MA, Eisenberger N, Sabb F, Mintz J, Cohen MI: Blunted activation in orbitofrontal cortex during mania: a functional magnetic resonance imaging study. Biol Psychiatry 2005; 58:763–769
51.
Fornito A, Yücel M, Wood SJ, Bechdolf A, Carter S, Adamson C, Velakoulis D, Saling MM, McGorry PD, Pantelis C: Anterior cingulate cortex abnormalities associated with a first psychotic episode in bipolar disorder. Br J Psychiatry 2009; 194:426–433
52.
Rotenberg VS: The peculiarity of the right-hemisphere function in depression: solving the paradoxes. Prog Neuropsychopharmacol Biol Psychiatry 2004; 28:1–13
53.
MacFall JR, Payne ME, Provenzale JE, Krishnan KR: Medial orbital frontal lesions in late-onset depression. Biol Psychiatry 2001; 49:803–806
54.
Glahn DC, Bearden CE, Barguil M, Barrett J, Reichenberg A, Bowden CL, Soares JC, Velligan DI: The neurocognitive signature of psychotic bipolar disorder. Biol Psychiatry 2007; 62:910–916
55.
Ananth H, Popescu I, Critchley HD, Good CD, Frackowiak RSJ, Dolan RJ: Cortical and subcortical gray matter abnormalities in schizophrenia determined through structural magnetic resonance imaging with optimized volumetric voxel-based morphometry. Am J Psychiatry 2002; 159:1497–1505
56.
Hulshoff Pol HE, Schnack HG, Mandl RC, van Haren NE, Koning H, Collins DL, Evans AC, Kahn RS: Focal gray matter density changes in schizophrenia. Arch Gen Psychiatry 2001; 58:1118–1125
57.
Farrow TF, Whitford TJ, Williams LM, Gomes L, Harris AW: Diagnosis-related regional gray matter loss over two years in first episode schizophrenia and bipolar disorder. Biol Psychiatry 2005; 58:713–723
58.
Job DE, Whalley HC, McConnell S, Glabus M, Johnstone EC, Lawrie SM: Structural gray matter differences between first-episode schizophrenics and normal controls using voxel-based morphometry. Neuroimage 2002; 17:880–889

Information & Authors

Information

Published In

Go to American Journal of Psychiatry
American Journal of Psychiatry
Pages: 530 - 539
PubMed: 21285139

History

Received: 24 June 2010
Revision received: 7 October 2010
Accepted: 29 October 2010
Published online: 1 May 2011
Published in print: May 2011

Authors

Details

Lara C. Foland-Ross, Ph.D.
From the Laboratory of NeuroImaging, Department of Neurology, and the Ahmanson-Lovelace Brain Mapping Center, UCLA School of Medicine, Los Angeles; the Departments of Biostatistics and of Psychiatry and Biobehavioral Sciences, UCLA; the Schizophrenia Research Institute, Darlinghurst, New South Wales, Australia; the Priority Centre for Brain and Mental Health Research, University of Newcastle, Callaghan, New South Wales; the Department of Psychiatry, VA Greater Los Angeles Healthcare System; and West Los Angeles Healthcare Center.
Paul M. Thompson, Ph.D.
From the Laboratory of NeuroImaging, Department of Neurology, and the Ahmanson-Lovelace Brain Mapping Center, UCLA School of Medicine, Los Angeles; the Departments of Biostatistics and of Psychiatry and Biobehavioral Sciences, UCLA; the Schizophrenia Research Institute, Darlinghurst, New South Wales, Australia; the Priority Centre for Brain and Mental Health Research, University of Newcastle, Callaghan, New South Wales; the Department of Psychiatry, VA Greater Los Angeles Healthcare System; and West Los Angeles Healthcare Center.
Catherine A. Sugar, Ph.D.
From the Laboratory of NeuroImaging, Department of Neurology, and the Ahmanson-Lovelace Brain Mapping Center, UCLA School of Medicine, Los Angeles; the Departments of Biostatistics and of Psychiatry and Biobehavioral Sciences, UCLA; the Schizophrenia Research Institute, Darlinghurst, New South Wales, Australia; the Priority Centre for Brain and Mental Health Research, University of Newcastle, Callaghan, New South Wales; the Department of Psychiatry, VA Greater Los Angeles Healthcare System; and West Los Angeles Healthcare Center.
Sarah K. Madsen, B.A.
From the Laboratory of NeuroImaging, Department of Neurology, and the Ahmanson-Lovelace Brain Mapping Center, UCLA School of Medicine, Los Angeles; the Departments of Biostatistics and of Psychiatry and Biobehavioral Sciences, UCLA; the Schizophrenia Research Institute, Darlinghurst, New South Wales, Australia; the Priority Centre for Brain and Mental Health Research, University of Newcastle, Callaghan, New South Wales; the Department of Psychiatry, VA Greater Los Angeles Healthcare System; and West Los Angeles Healthcare Center.
Jim K. Shen, B.S.
From the Laboratory of NeuroImaging, Department of Neurology, and the Ahmanson-Lovelace Brain Mapping Center, UCLA School of Medicine, Los Angeles; the Departments of Biostatistics and of Psychiatry and Biobehavioral Sciences, UCLA; the Schizophrenia Research Institute, Darlinghurst, New South Wales, Australia; the Priority Centre for Brain and Mental Health Research, University of Newcastle, Callaghan, New South Wales; the Department of Psychiatry, VA Greater Los Angeles Healthcare System; and West Los Angeles Healthcare Center.
Conor Penfold, B.A.
From the Laboratory of NeuroImaging, Department of Neurology, and the Ahmanson-Lovelace Brain Mapping Center, UCLA School of Medicine, Los Angeles; the Departments of Biostatistics and of Psychiatry and Biobehavioral Sciences, UCLA; the Schizophrenia Research Institute, Darlinghurst, New South Wales, Australia; the Priority Centre for Brain and Mental Health Research, University of Newcastle, Callaghan, New South Wales; the Department of Psychiatry, VA Greater Los Angeles Healthcare System; and West Los Angeles Healthcare Center.
Kyle Ahlf, B.A.
From the Laboratory of NeuroImaging, Department of Neurology, and the Ahmanson-Lovelace Brain Mapping Center, UCLA School of Medicine, Los Angeles; the Departments of Biostatistics and of Psychiatry and Biobehavioral Sciences, UCLA; the Schizophrenia Research Institute, Darlinghurst, New South Wales, Australia; the Priority Centre for Brain and Mental Health Research, University of Newcastle, Callaghan, New South Wales; the Department of Psychiatry, VA Greater Los Angeles Healthcare System; and West Los Angeles Healthcare Center.
Paul E. Rasser, M.S.
From the Laboratory of NeuroImaging, Department of Neurology, and the Ahmanson-Lovelace Brain Mapping Center, UCLA School of Medicine, Los Angeles; the Departments of Biostatistics and of Psychiatry and Biobehavioral Sciences, UCLA; the Schizophrenia Research Institute, Darlinghurst, New South Wales, Australia; the Priority Centre for Brain and Mental Health Research, University of Newcastle, Callaghan, New South Wales; the Department of Psychiatry, VA Greater Los Angeles Healthcare System; and West Los Angeles Healthcare Center.
Jeffrey Fischer, B.A.
From the Laboratory of NeuroImaging, Department of Neurology, and the Ahmanson-Lovelace Brain Mapping Center, UCLA School of Medicine, Los Angeles; the Departments of Biostatistics and of Psychiatry and Biobehavioral Sciences, UCLA; the Schizophrenia Research Institute, Darlinghurst, New South Wales, Australia; the Priority Centre for Brain and Mental Health Research, University of Newcastle, Callaghan, New South Wales; the Department of Psychiatry, VA Greater Los Angeles Healthcare System; and West Los Angeles Healthcare Center.
Yilan Yang, B.A.
From the Laboratory of NeuroImaging, Department of Neurology, and the Ahmanson-Lovelace Brain Mapping Center, UCLA School of Medicine, Los Angeles; the Departments of Biostatistics and of Psychiatry and Biobehavioral Sciences, UCLA; the Schizophrenia Research Institute, Darlinghurst, New South Wales, Australia; the Priority Centre for Brain and Mental Health Research, University of Newcastle, Callaghan, New South Wales; the Department of Psychiatry, VA Greater Los Angeles Healthcare System; and West Los Angeles Healthcare Center.
Jennifer Townsend, B.A.
From the Laboratory of NeuroImaging, Department of Neurology, and the Ahmanson-Lovelace Brain Mapping Center, UCLA School of Medicine, Los Angeles; the Departments of Biostatistics and of Psychiatry and Biobehavioral Sciences, UCLA; the Schizophrenia Research Institute, Darlinghurst, New South Wales, Australia; the Priority Centre for Brain and Mental Health Research, University of Newcastle, Callaghan, New South Wales; the Department of Psychiatry, VA Greater Los Angeles Healthcare System; and West Los Angeles Healthcare Center.
Susan Y. Bookheimer, Ph.D.
From the Laboratory of NeuroImaging, Department of Neurology, and the Ahmanson-Lovelace Brain Mapping Center, UCLA School of Medicine, Los Angeles; the Departments of Biostatistics and of Psychiatry and Biobehavioral Sciences, UCLA; the Schizophrenia Research Institute, Darlinghurst, New South Wales, Australia; the Priority Centre for Brain and Mental Health Research, University of Newcastle, Callaghan, New South Wales; the Department of Psychiatry, VA Greater Los Angeles Healthcare System; and West Los Angeles Healthcare Center.
Lori L. Altshuler, M.D.
From the Laboratory of NeuroImaging, Department of Neurology, and the Ahmanson-Lovelace Brain Mapping Center, UCLA School of Medicine, Los Angeles; the Departments of Biostatistics and of Psychiatry and Biobehavioral Sciences, UCLA; the Schizophrenia Research Institute, Darlinghurst, New South Wales, Australia; the Priority Centre for Brain and Mental Health Research, University of Newcastle, Callaghan, New South Wales; the Department of Psychiatry, VA Greater Los Angeles Healthcare System; and West Los Angeles Healthcare Center.

Notes

Address correspondence and reprint requests to Dr. Altshuler, 300 UCLA Medical Plaza, Suite 1544, Box 957057, Los Angeles, CA 90095-7057; [email protected] (e-mail).

Funding Information

Dr. Altshuler has served on advisory boards or speakers bureaus for Forest Laboratories, Merck, and Sepracor. The other authors report no financial relationships with commercial interests.Supported by NIMH grants MH078556, MH075944, and MH01848; NARSAD; National Center for Research Resources grants AG016570, EB01651, RR019771, RR12169, RR13642, and RR00865; and the National Institute on Aging, the National Institute of Biomedical Imaging and Bioengineering, the Brain Mapping Medical Research Organization, the Brain Mapping Support Foundation, the Pierson-Lovelace Foundation, the Ahmanson Foundation, the William M. and Linda R. Dietel Philanthropic Fund at the Northern Piedmont Community Foundation, the Tamkin Foundation, the Jennifer Jones-Simon Foundation, the Capital Group Companies Charitable Foundation, the Robson Family, and the Northstar Fund.

Metrics & Citations

Metrics

Citations

Export Citations

If you have the appropriate software installed, you can download article citation data to the citation manager of your choice. Simply select your manager software from the list below and click Download.

For more information or tips please see 'Downloading to a citation manager' in the Help menu.

Format
Citation style
Style
Copy to clipboard

View Options

View options

PDF/EPUB

View PDF/EPUB

Login options

Already a subscriber? Access your subscription through your login credentials or your institution for full access to this article.

Personal login Institutional Login Open Athens login
Purchase Options

Purchase this article to access the full text.

PPV Articles - American Journal of Psychiatry

PPV Articles - American Journal of Psychiatry

Not a subscriber?

Subscribe Now / Learn More

PsychiatryOnline subscription options offer access to the DSM-5-TR® library, books, journals, CME, and patient resources. This all-in-one virtual library provides psychiatrists and mental health professionals with key resources for diagnosis, treatment, research, and professional development.

Need more help? PsychiatryOnline Customer Service may be reached by emailing [email protected] or by calling 800-368-5777 (in the U.S.) or 703-907-7322 (outside the U.S.).

Media

Figures

Other

Tables

Share

Share

Share article link

Share