Eighty patients entered the 6-week open-label fluphenazine trial. Seventy-five patients completed the 6-week trial, and none met the improvement criteria. Of the five patients who failed to complete this phase, three dropped out because they could not be stabilized within the dosage range (N=1) or decompensated (N=2), one was removed because of drug abuse, and one declined further study participation. These five patients were continued in clinical care, and the 75 patients who completed the fluphenazine trial were entered into the 10-week double-blind study.
10-Week Double-Blind Study
Thirty-eight of the 75 patients who entered the 10-week double-blind trial were randomly assigned to clozapine treatment, and 37 were randomly assigned to haloperidol. Sixty-four patients completed the study. Of the 11 patients who failed to complete the study, eight had been assigned to clozapine and three had been assigned to haloperidol. Patients assigned to clozapine dropped out for the following reasons: noncompliance (N=3), relapse (N=3), low RBC count (N=1), and seizures (N=1). Patients assigned to haloperidol dropped out for the following reasons: relapse (N=2) and declining to continue study participation (N=1). There were no significant differences between the patients who completed the study and those who dropped out in age (completers: mean=36 years, SD=8; noncompleters: mean=36 years, SD=6); sex (completers: 70% male; noncompleters: 64% male); duration of illness (completers: mean=16 years, SD=7; noncompleters: mean=16 years, SD=6); baseline BPRS positive symptom score (completers: mean=3.0, SD=1.1; noncompleters: mean=3.2, SD=1.0); and baseline SANS total score (completers: mean=26.3, SD=12.4; noncompleters: mean=26.0, SD=9.9).
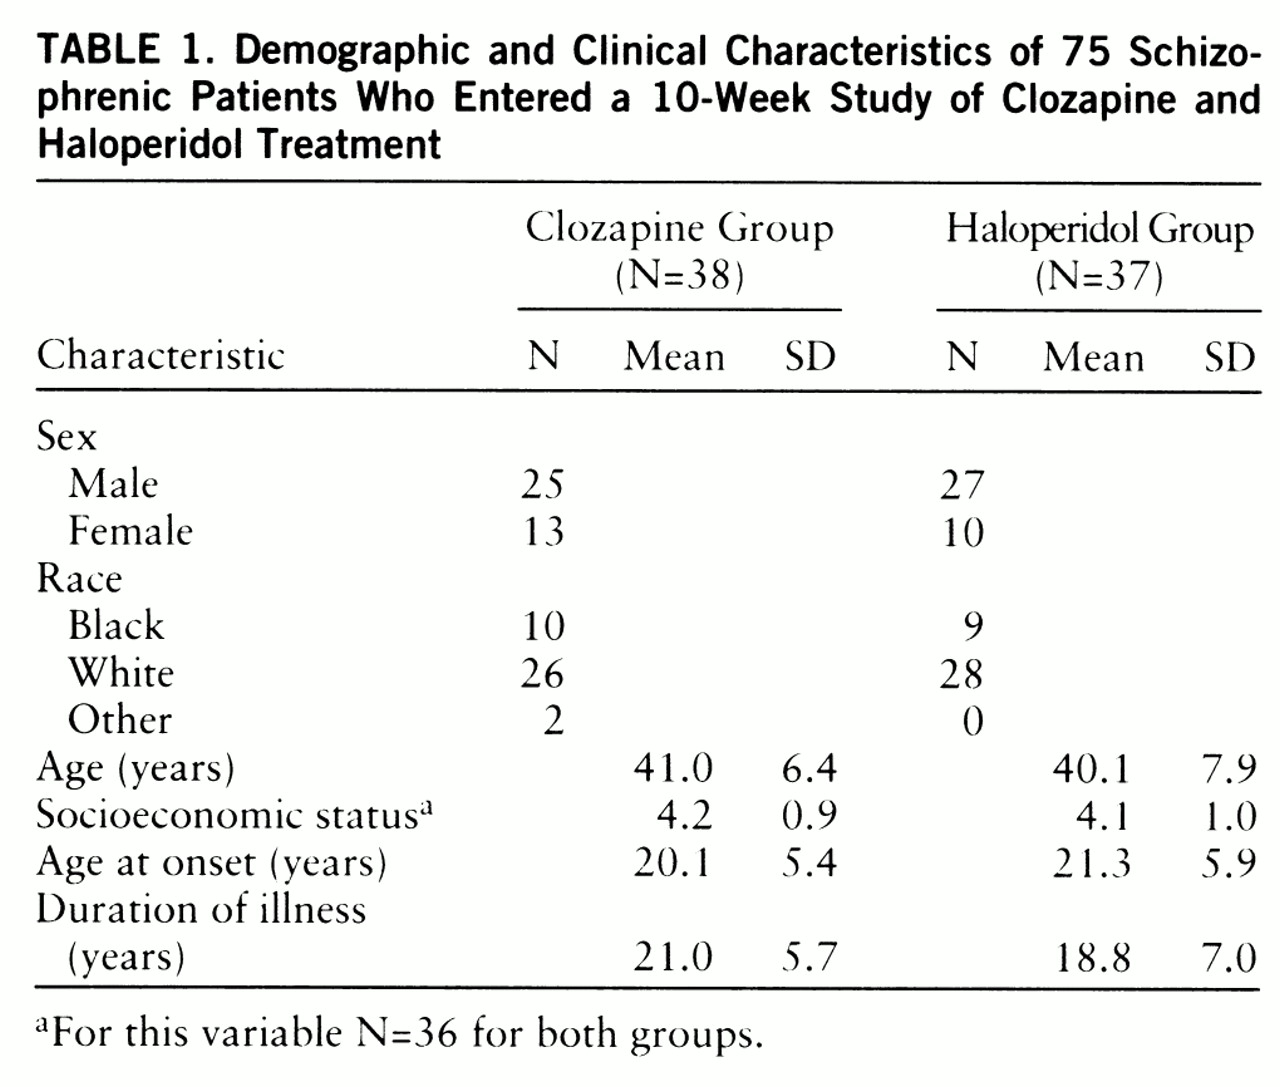
Demographic and clinical characteristics of the 75 patients who entered the 10-week double-blind study are presented in
table 1. The two treatment groups were very similar on these variables, with no significant differences observed. There were also no significant differences between groups in the demographic and clinical characteristics of the 64 patients who completed the study (data not shown).
The deficit/nondeficit categorizations of the 75 patients who entered the study were as follows: in the clozapine group, 10 deficit patients and 27 nondeficit patients; in the haloperidol group, 11 deficit patients and 26 nondeficit patients. The deficit/nondeficit categorizations of the 64 patients who completed the study were as follows: in the clozapine group, eight deficit and 21 nondeficit patients; in the haloperidol group, 11 deficit and 23 nondeficit patients. One patient who was randomly assigned to clozapine and completed the study could not be unambiguously categorized. There were no significant interactions between treatment assignment and deficit/nondeficit categorization for any of the demographic or clinical variables for either the patients who entered the study or those who completed it.
The end-of-study medication dosages for the patients who entered the study and those who completed it are presented in
table 2. At the end of the study, there were no significant differences in clozapine or haloperidol dosage between the deficit and nondeficit patients who either entered the study or completed it.
Positive symptom response. In the intent-to-treat analyses, there were no significant differences between clozapine and haloperidol for positive symptoms (
table 3). The failure to find a difference between clozapine and haloperidol patients was observed in both the analyses with the deficit/nondeficit categorization as a grouping variable (F=1.70, df=1,69, p=0.20) and those without it (F=1.46, df=1,72, p=0.23).
In contrast, in the completer analyses, clozapine was significantly superior to haloperidol for positive symptoms (
table 4). In the ANCOVA with the deficit/nondeficit categorization as an additional grouping variable, there was also a significant effect of treatment assignment. The interaction between treatment assignment and the deficit/nondeficit categorization was not significant (F=0.15, df=1,58, p=0.70).
Negative symptom response. In the intent-to-treat analyses, there were no significant differences between clozapine and haloperidol for negative symptoms in either the analyses with the deficit/nondeficit categorization as a grouping variable (F=0.54, df=1,69, p=0.32) or those without it (F=0.41, df=1,72, p=0.52) (
table 3). There were no significant clozapine/haloperidol differences for any of the SANS factor scores. Similar results were observed in the completer analyses. There were no significant treatment effects observed in either the analyses with the deficit/nondeficit categorization as a grouping variable (F=2.38, df=1,58, p=0.13) or those without it (F=1.82, df=1,61, p=0.18) (
table 4). However, there was a significant difference between clozapine and haloperidol for the SANS anhedonia factor score (F=6.96, df=1,61, p=0.01). This difference was primarily due to a worsening of this score for patients who received haloperidol (for clozapine patients, percent change=–2.0%; for haloperidol patients, percent change=8.3%). The interaction between treatment assignment and the deficit/nondeficit categorization for the SANS anhedonia factor was not significant (F=0.31, df=1,58, p=0.58).
Other measures. In the intent-to-treat analyses, there were no significant differences between clozapine and haloperidol for BPRS total score in the analyses with and without the deficit/nondeficit categorization as a grouping variable (
table 3) (F=0.45, df=1,69, p=0.41, and F=1.56, df=1,72, p=0.22, respectively).
Clozapine treatment was associated with a significant reduction in Simpson-Angus Rating Scale total score. Significant differences between clozapine and haloperidol were observed in the analyses with and those without the deficit/nondeficit categorization as a grouping variable (
table 3). The interaction between treatment assignment and the deficit/nondeficit categorization was not significant (F=2.16, df=1,69, p=0.15). There were no significant effects observed for the Maryland Psychiatric Research Center Tardive Dyskinesia Scale dyskinesia score in either the analyses with the deficit/nondeficit categorization as a grouping variable (F=1.16, df=1,69, p=0.29) or those without it (F=1.10, df=2,72, p=0.30) (
table 3).
The same pattern of results for BPRS and Simpson-Angus Rating Scale total scores and for dyskinesia score was observed in the completer analyses (
table 4).
There were no significant differences between clozapine and haloperidol in either the intent-to-treat or the completer analyses for the BPRS anxiety/depression, hostility, or activation factors.
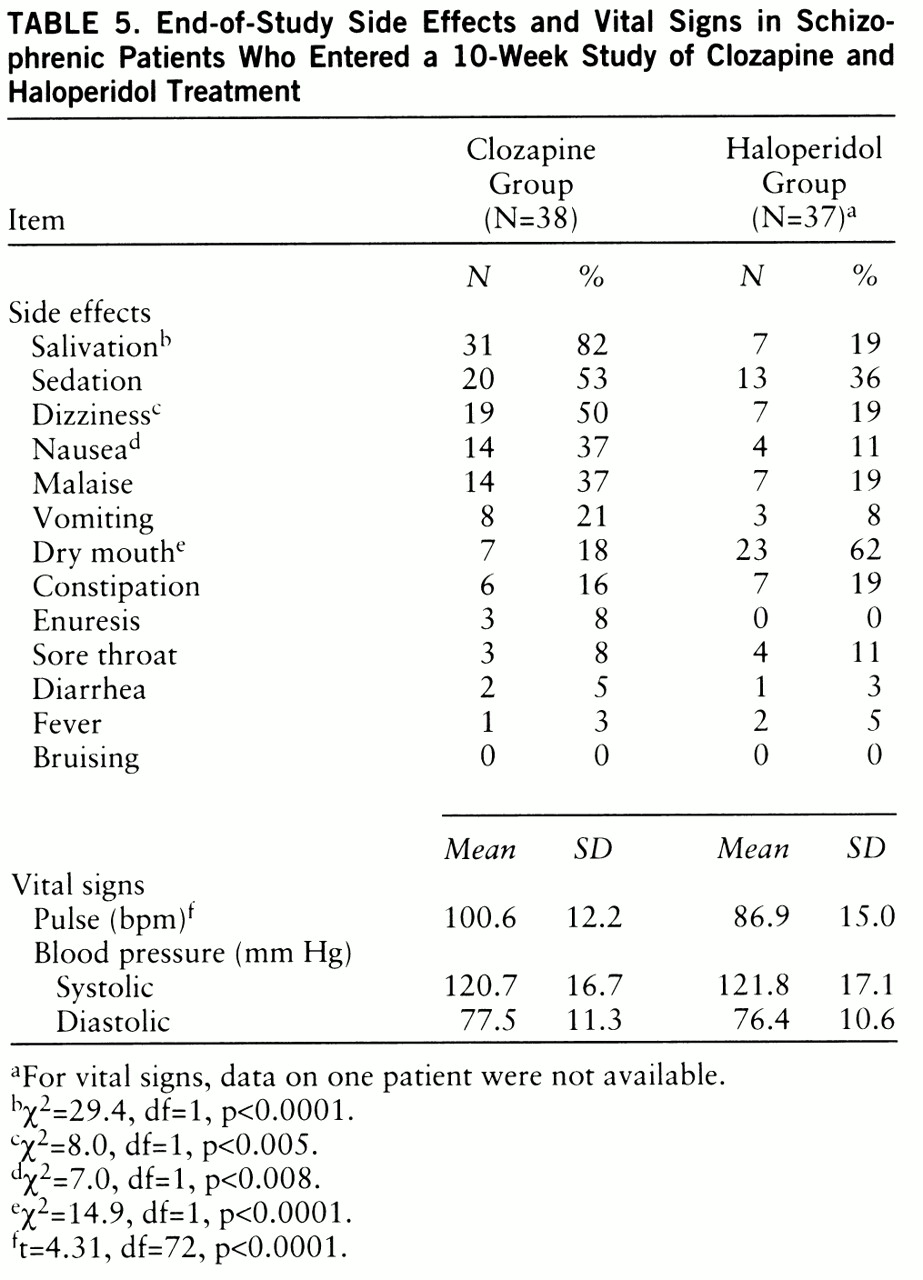
Side effects and vital signs. The end-of-study side effect and vital sign data for the 75 patients who entered the study are listed in
table 5. The numbers are based on the last available rating. There were no significant differences between the two groups in baseline level of side effects. Dizziness, salivation, and nausea were significantly more common in patients treated with clozapine (
table 5). In contrast, dry mouth was significantly more common in the haloperidol-treated patients. The same pattern of results was observed in patients who completed the study.
The baseline and end-of-study (10-week) mean weights of the clozapine-treated patients were 171.5 lb (SD=39.4) and 180.6 lb (SD=41.4), respectively. For the haloperidol-treated patients the baseline mean was 174.4 lb (SD=37.4) and the end-of-study mean was 174.8 lb (SD=37.4). The difference between groups in weight gain was significant (F=29.6, df=1,71, p<<0.0001). The difference between groups among the patients who completed the study was also significant (F=33.2, df=1,60, p<<0.0001).
There were no significant differences between the two medication groups in baseline vital sign values. In both the group who entered the study and the group who completed the study, clozapine-treated patients had significantly higher pulse rates (t=4.31, df=72, p<0.0001, and t=4.22, df=62, p<0.0001, respectively). There were no significant differences between the clozapine-treated patients and the haloperidol-treated patients in either systolic or diastolic blood pressure.
One-Year Open-Label Study
Sixty-one of the 64 patients who completed the double-blind study entered the 1-year open-label descriptive study. All three patients who did not enter the year-long descriptive study had been randomly assigned to haloperidol treatment in the double-blind study; two patients declined the 6-week open-label clozapine trial and chose to remain on a haloperidol regimen, and one patient developed marked liver enzyme elevation during the 6-week open-label clozapine trial. Fifty-eight patients completed the study; the three patients who dropped out failed to complete the study because of relapse associated with noncompliance (N=2) or lack of response to treatment (N=1).
The deficit/nondeficit categorizations for the 58 patients who completed the study were as follows: deficit patients, N=19; nondeficit patients, N=38. As mentioned above, one patient could not be unambiguously categorized.
The mean end-of-study clozapine dose was 463.8 mg/day (SD=111.3). The end-of-study dose did not differ between the deficit group (mean=467.1 mg/day, SD=112.7) and the nondeficit group (mean=457.9 mg/day, SD=110.3) (t=0.30, df=55, p=0.77).
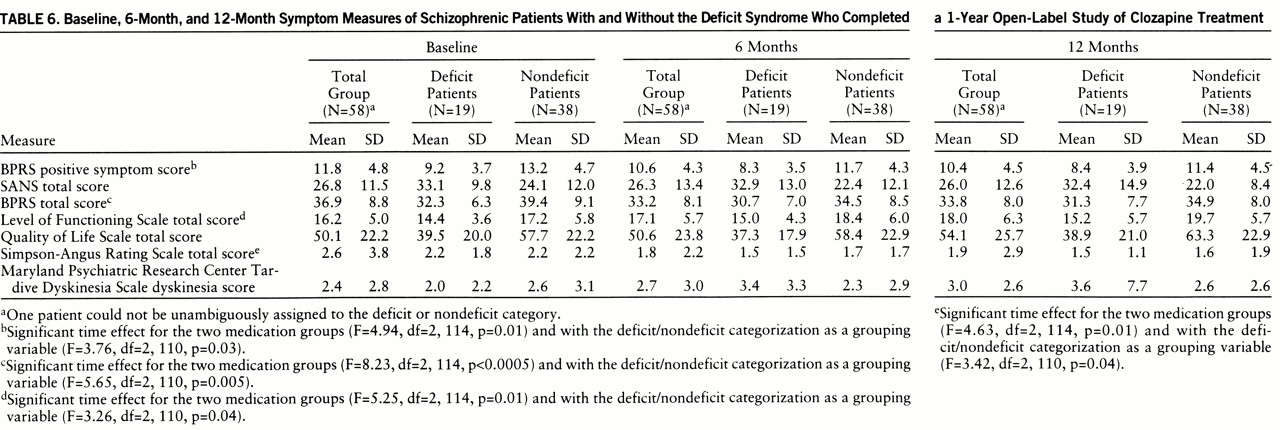
Positive and negative symptom response. Open-label clozapine treatment was associated with significant improvement in positive symptoms; the time effect was significant in the analyses with the deficit/nondeficit categorization as a grouping variable and those without it (
table 6). The interaction between time and deficit/nondeficit categorization was not significant (F=0.47, df=2,110, p=0.63). In contrast, open-label clozapine treatment was not associated with a significant improvement in negative symptoms. The time effect was not significant in the analyses both with and without the deficit/nondeficit categorization as a grouping variable (F=0.45, df=2,110, p=0.64, and F=0.53, df=2,114, p=0.59, respectively). The interaction between time and deficit/nondeficit categorization was also not significant (F=0.15, df=2,110, p=0.86).
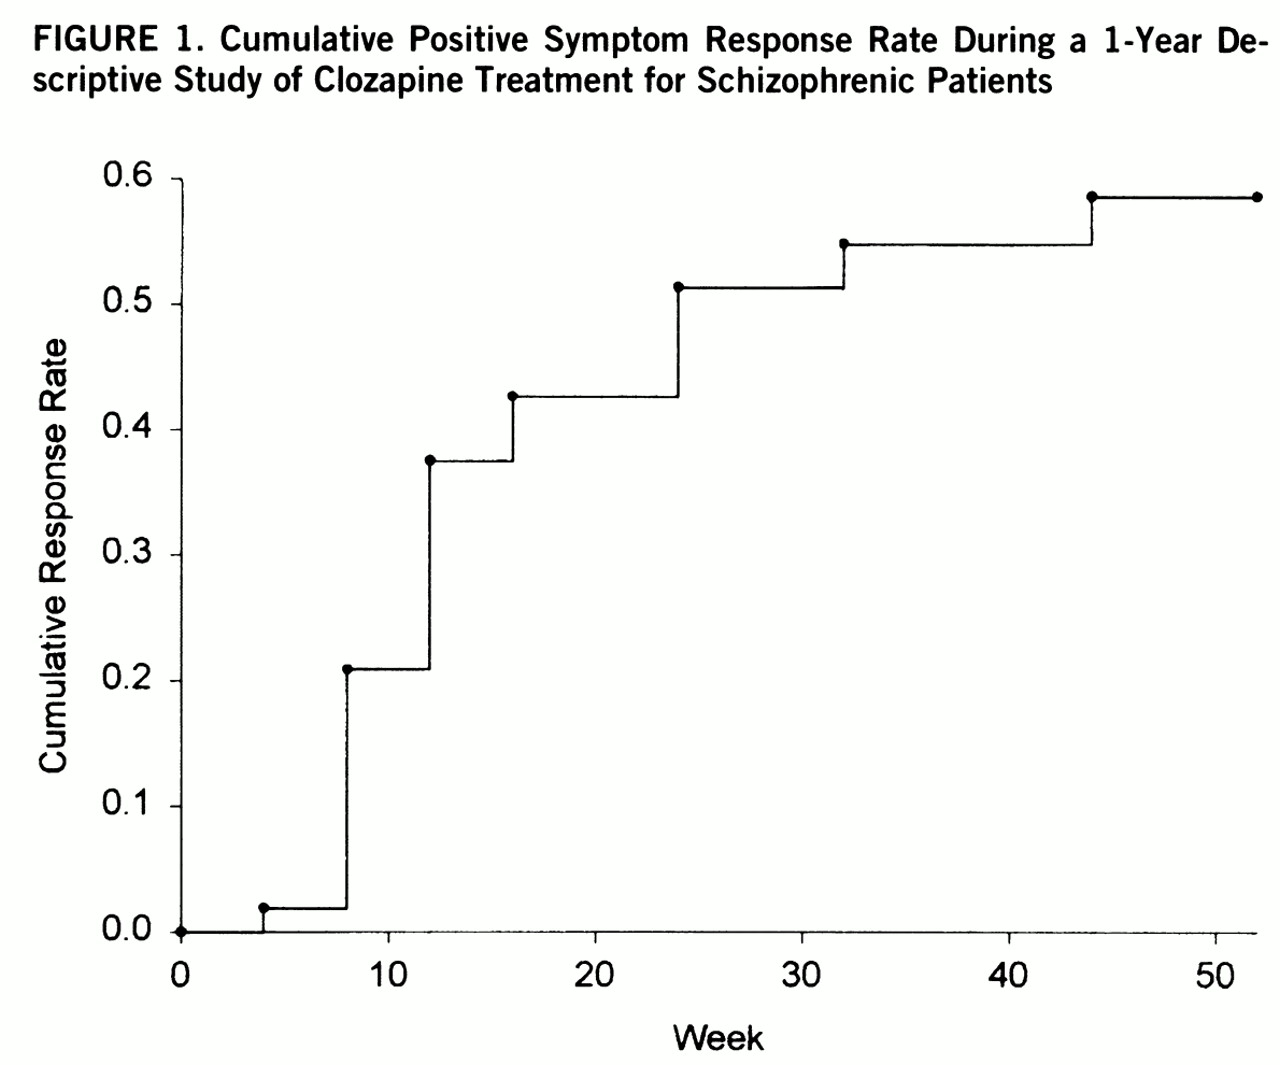
Fifty-three of the 61 patients who entered the 1-year open-label study had met the 10-week double-blind minimum positive symptom level entry criteria. Twenty-six of the 53 patients (49%) met the criteria for sustained clinical response. The responders had a significantly earlier age at onset (mean=18.3 years, SD=5.0) than the nonresponders (mean=22.3 years, SD=6.2) (F=6.52, df=1,51, p=0.01). There were no significant differences between responders and nonresponders in age, sex, race, length of illness, clozapine dosage, or proportion of deficit patients. The time course for response is depicted in
figure 1.
Other measures. There was a significant time effect for BPRS total score. This effect was observed in both the analyses with the deficit/nondeficit categorization as a grouping variable and those without it. The interaction between time and deficit/nondeficit categorization was not significant (F=1.74, df=2,110, p=0.18). The decline in BPRS total score occurred during the first 6 months of treatment (
table 6). There were also significant reductions in the BPRS anxiety/depression factor scores (F=5.84, df=2,114, p=0.004), hostility factor scores (F=4.51, df=2,114, p=0.01), and activation factor scores (F=6.55, df=2,114, p=0.01) (data not shown). The time effects for the anxiety and activation factor scores remained significant when the deficit/nondeficit categorization was added as a grouping variable. There was a significant interaction between time and deficit/nondeficit categorization (F=3.81, df=2,110, p<<0.03) for the hostility factor, and the time effect was no longer significant (F=2.68, df=2,110, p=0.07), which suggests that the effect of clozapine on hostility was limited to the nondeficit patients.
There was a significant time effect for the Level of Functioning Scale total score, with patients showing a linear improvement over the course of the study (
table 6). The time effect was significant for both the analyses with the deficit/nondeficit categorization as a grouping variable and those without it. The interaction between time and deficit/nondeficit categorization was not significant (F=0.91, df=2,110, p=0.47). To assess whether the observed change in Level of Functioning Scale score was related to the observed improvements in positive, affective, or extrapyramidal symptoms, we examined the correlations between change in these measures and change in the Level of Functioning Scale scores. There were no significant relationships.
The time effect for Quality of Life Scale total score was not significant in the analyses with and without the deficit/nondeficit categorization as a grouping variable (F=1.19, df=2,110, p=0.31, and F=2.08, df=2,114, p=0.13, respectively). The interaction between time and deficit/nondeficit categorization was also not significant (F=1.01, df=2,110, p=0.37).
There was a significant reduction in Simpson-Angus Rating Scale total scores (
table 6). This significant time effect was observed in both the analyses with the deficit/nondeficit categorization as a grouping variable and those without it. The interaction between time and deficit/nondeficit categorization was not significant (F=0.01, df=2,110, p=0.99). There was no significant time effect for dyskinesia scores in either the analyses with the deficit/nondeficit categorization as a grouping variable (F=1.93, df=2,110, p=0.15) or those without it (F=1.13, df=2,114, p=0.33), and the interaction between time and deficit/nondeficit categorization was not significant (F=2.50, df=2,110, p=0.09).
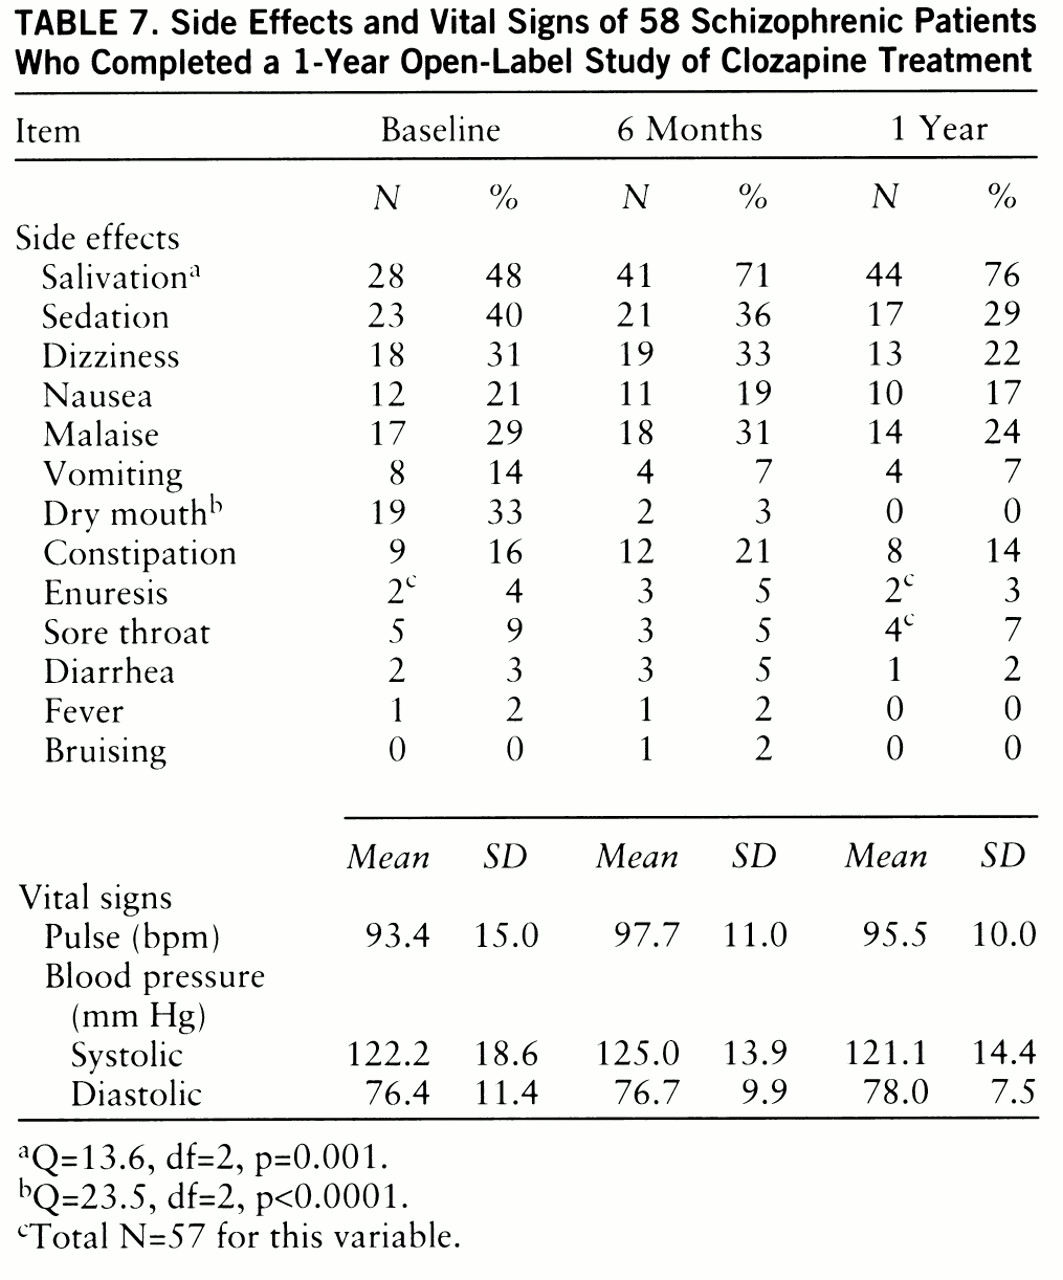
Side effects and vital signs. In general, there was a mild decrease in side effects from baseline levels over the course of the year (
table 7) (baseline represents the level of side effects after 10 weeks of clozapine treatment for the patients assigned to clozapine during the 10-week double-blind study or after 6 weeks of open-label clozapine for the patients first assigned to haloperidol). There was a significant decrease in the occurrence of dry mouth. The only side effect that significantly increased over the baseline level was salivation.
There was a significant time effect for weight gain (F=7.94, df=2,100, p=0.001), with patients continuing to gain weight over the first 6 months of treatment (baseline: mean weight=182.7 lb, SD=42.5; 6 months: mean=188.7 lb, SD=43.3; 12 months: mean=187.1 lb, SD=41.0). Vital signs were relatively constant over the course of the year.
